CData Arc is an integration platform that can be scaled up to process large volumes of data, but it is inherently an application solution that will be limited by the resources of the system hosting it. When system limitations are encountered this can have negative performance impacts on the application.
Arc introduced health checks into the application regarding system resources beginning with the 2021 release of the application. These checks trigger application-wide alerts based on factors that could negatively affect performance in the application. These factors include the number of records in the backend application database, memory usage, disk usage, and the number of files in individual application folders.
Individually, each health check alert raised by the application is not an immediate cause for concern. However, if alerts are persistent and trend upward, they can predict more serious conditions that could become more difficult to resolve.
Below are examples of notifications from the health checks and how to interpret them:
The number of records in AppDB was 145505 at 2024-04-16T07:00:00+00:00, which exceeded the threshold value of 100000.
This type of Alert lets you know that the number of records in your backend database has exceeded the default 100,000 records. There will likely not be any immediate issues crossing this threshold, but if the number of records in your backend database is allowed to grow far past this threshold, it can lead to performance and disk issues particularly with the default lightweight Derby (Cross-Platform version) or SQLite (.NET version) databases.
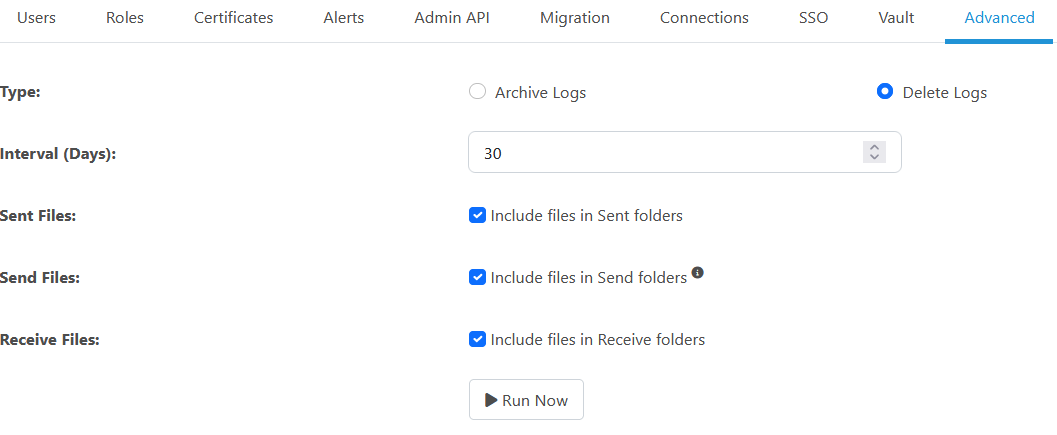
Arc’s cleanup process (Settings->Advanced->Cleanup Options) will delete records from your backend database that are older than the specified interval. If you are seeing large amounts of traffic which is causing this warning to appear, you may want to shorten the cleanup interval in your settings to a fewer number of days.
If you are expecting to process high volumes of records, you may want to consider switching Arc to use a more robust backend database such as SQLServer or PostgreSQL:
Cross Platform Edition: https://cdn.cdata.com/help/AZK/mft/Cross-Platform-Edition.html#configure-the-application-database
.NET Edition: https://cdn.cdata.com/help/AZK/mft/Windows-Edition.html#configuring-the-application-database
Connector [YourConnectorName]:
The number of items in the [Receive] folder was 8000 at 2024-04-12T07:00:00+00:00, which exceeded the threshold value of 5000.
This type of Alert lets you know that the number of files in a particular connector’s Receive/Output folder has reached more than 5000 files. Typically, this is indicative of files that may not be cleaned up, but if a directory grows to contain 100,000 files or more, any file system operations that create or move files to this folder will experience diminished file I/O performance. Maintaining these directories clean helps ensure optimal performance.
Since the later releases of Arc 2023, there has also been an optional setting in Arc’s Cleanup that would allow files in connector’s received folders to also be picked up as part of Arc’s cleanup operations if the files are older than the cleanup interval.

However, in general we recommend that files that you receive in Arc are handled in some way by you. As part of our Best Practices, if you are directly interacting with the files in the Receive directories of connectors, we would instead encourage you to use a File Connector to place files in a directory outside of Arc’s own application directories to help prevent any performance or concurrency issues: https://cdn.cdata.com/help/AZK/mft/Designing-a-Flow.html#interacting-with-the-local-file-system
The disk usage was 62.10% at 2024-05-23T17:00:14-05:00, which exceeded the threshold value of 60%.
This type of Alert lets you know that the application detected that the amount of disk space being used has reached more than 60%. Disk usage is calculated based on the entire disk drive that is used for the Application Directory, so the space used by other applications or programs will also count toward the disk usage check.
The memory usage was 67.83% at 2024-04-22T14:00:36+00:00, which exceeded the threshold value of 60%.
This type of Alert lets you know that memory usage on your machine passed the configured threshold for the Arc process (this is more likely to appear on Linux systems). If this is temporary this may not be cause for concern as the application could be using more memory when processing larger files.
If this is consistently occurring and your flows involve mappings, you may want to enable XMLStreaming in the Advanced settings of your XMLMap connectors to try to mitigate this. Making the best use of XMLStreaming is discussed in more detail in another one of our community forum articles here: https://community.cdata.com/cdata-arc-48/mapping-a-document-with-parent-child-relationships-to-csv-larger-files-188?tid=188&fid=48
Another possible cause for consistently high memory use is if you are using a backend database that has grown bloated over time. Due to the large volumes of records, the application will need to consume higher amounts of memory and CPU when it attempts to communicate with the database to read and write information.
Health Check Settings Adjustments
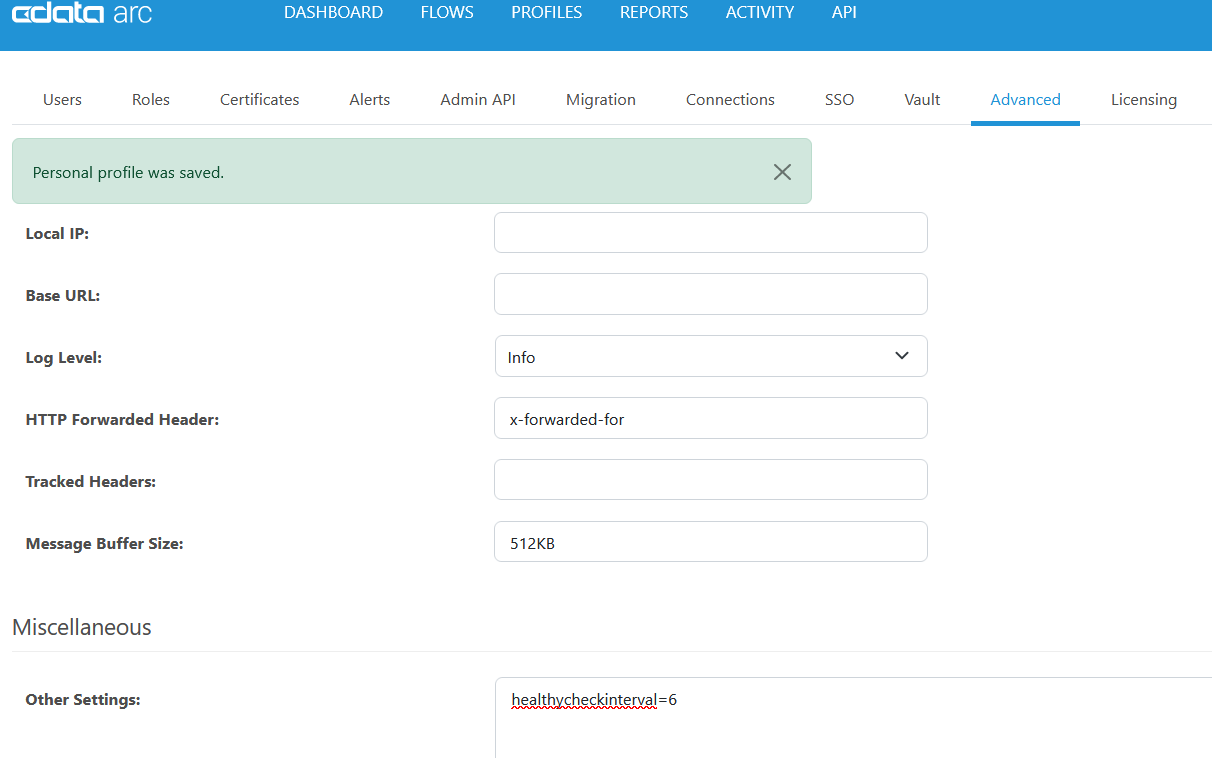
While these alerts are helpful in identifying system resource concerns and helping to prevent critical issues, these alerts may sometimes need to be tuned more specifically to an individual system or circumstances. The settings for these Alerts can be manually updated from the Global Settings->Advanced->Other Settings.
By default, the application will run the health checks once every hour, however, the interval for this can be adjusted by setting healthycheckinterval= Number of hours.

You can also adjust the thresholds for when you are alerted about each of the system resource checks.
-
The default threshold defined for alerts about the number of records in the default backend database is 100,000, but it can be adjusted by setting checkdbrecordscntreportlimit=number of transactions.
-
The default threshold defined for alerts about the number of files in Arc’s internal connectors is 5000, but it can be adjusted by setting checkitemsnumberinfoldersreportlimit=number of files in folders.
-
The default threshold defined for the alerts about the disk usage is 60, but it can be adjusted by setting checkdiskusagereportlimit=limit in %.
-
The default threshold defined for alerts about the memory usage is 60, but it can be adjusted by setting checkmemoryusagereportlimit=limit in %.


