Given the increasing reliance of companies on their IT infrastructure to maintain competitiveness and fulfill customer needs, effectively managing and monitoring their IT environments can pose a significant challenge in the absence of appropriate tools.
Datadog is a cloud-based monitoring and analytics platform that helps organizations gain real-time visibility into their IT infrastructure.
This article consists of detailed steps related to enablement of the integration between CData Sync and Datadog.
NOTE: This article can be taken into account for other CData applications that auto-generate logfiles from their operational activities (i.e. “CData Arc”, “CData Connect Server”)
Step 1: Install the latest version of Datadog Agent (assuming that you already have a Datadog account)
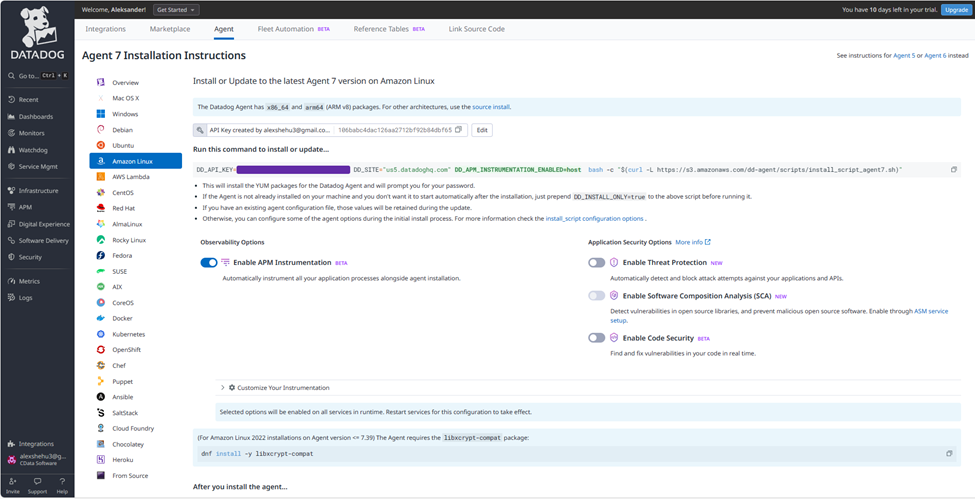
On the UI of your Datadog’s instance, hover into “Integrations” and then click “Agent”, in order to access the page that will help you with the installation of the agent.
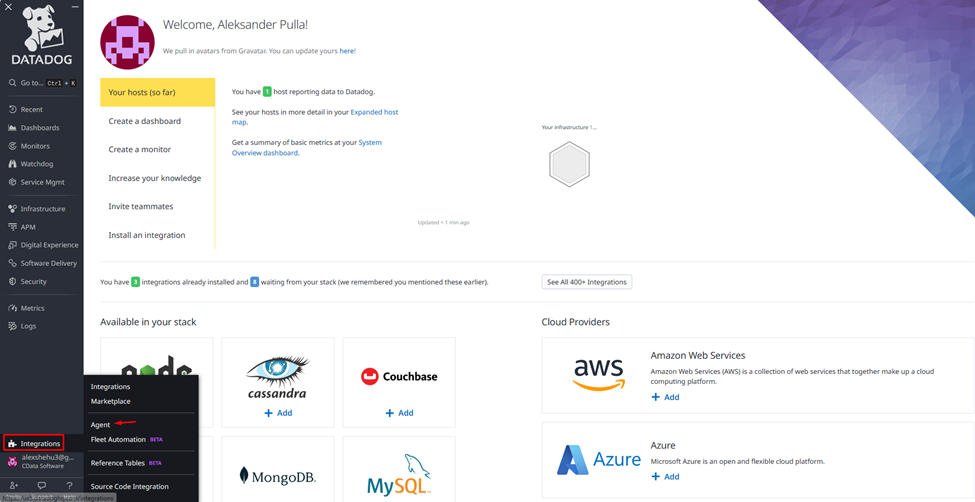
Once you are on the “Agent” page, select your desired OS (in my case I have used Amazon Linux) and follow the instructions
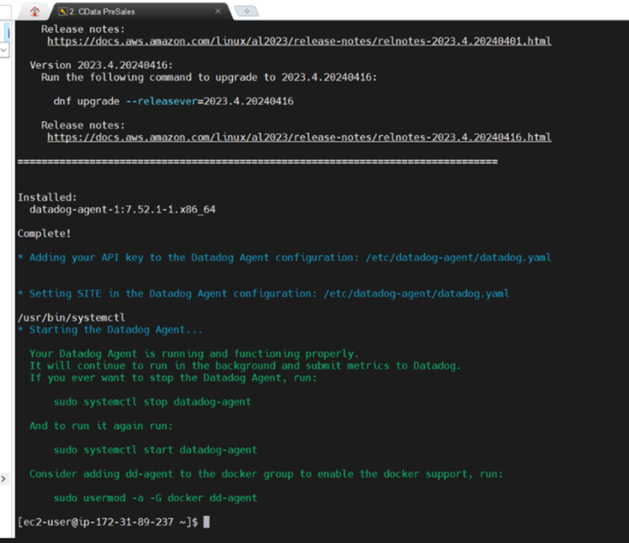
Give it some time until the machine installs the required resources for the agent, as well as to attach the API_KEY of your instance within itself. You should see something like below, in case the steps have been followed precisely and everything succeeds:
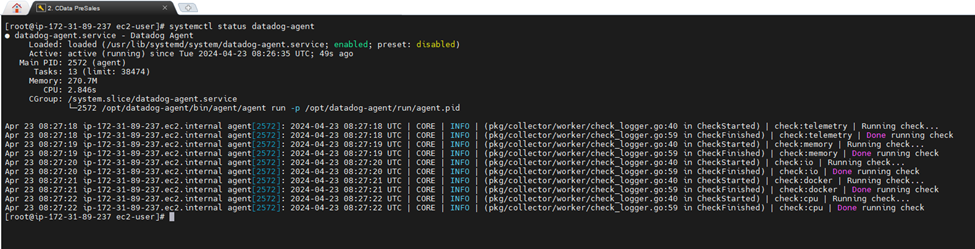
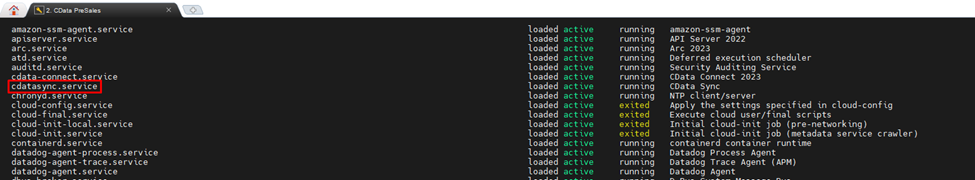
For a double check, you can also inspect the running services if the Datadog Agent is working properly (as following):
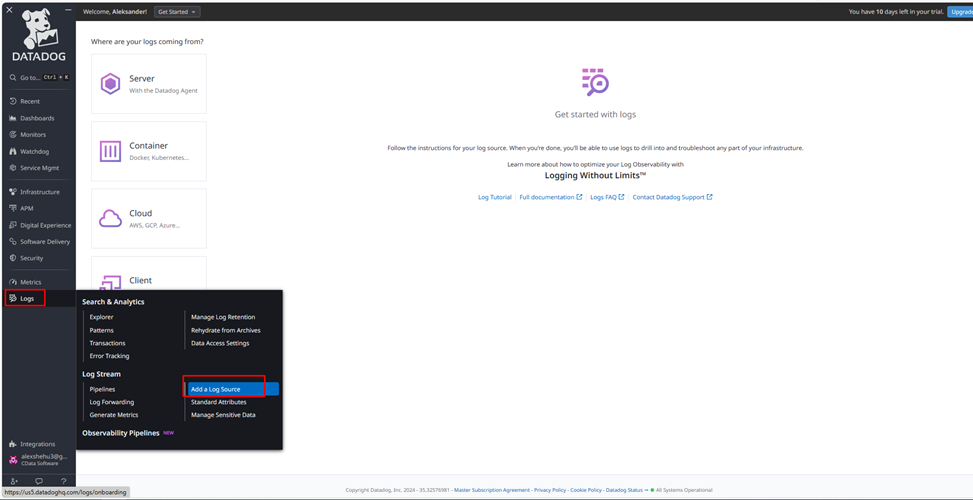
Step 2: Adding a Log Source
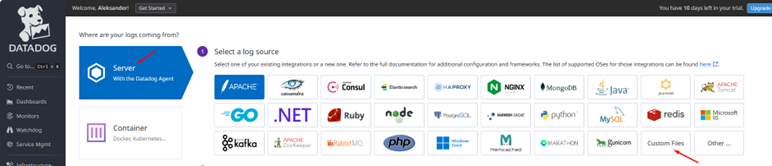
On the sidebar, go to “Logs” then access “Add a Log Source” page:
Within that page, this is where the enablement of the integration will happen.
The first thing to be done is to select “Custom Files” from the list of log sources (since CData Sync is not officially an integrator within Datadog).
As per the instructions of step (2), we must enable log collection in Datadog Agent configuration file (“datadog.yaml” file), in order for the agent to capture Syng logfiles.
The configuration file should look something like this:
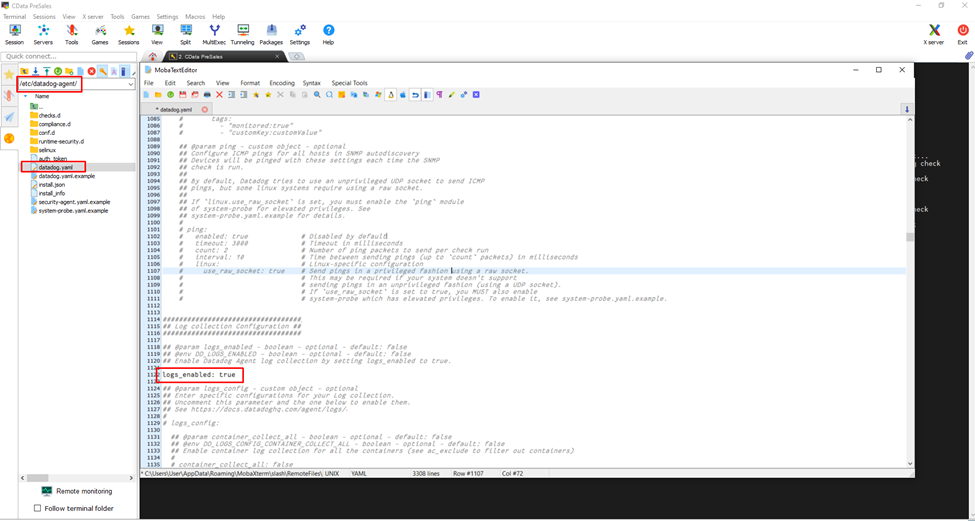
Once the “logs_enabled” parameter is enabled (by removing “#” symbol) restart the service of Datadog Agent.
Moving on, it is time to define the path of CData Sync logs, its service name, and the Source (in my case I have used the Apache integrator)
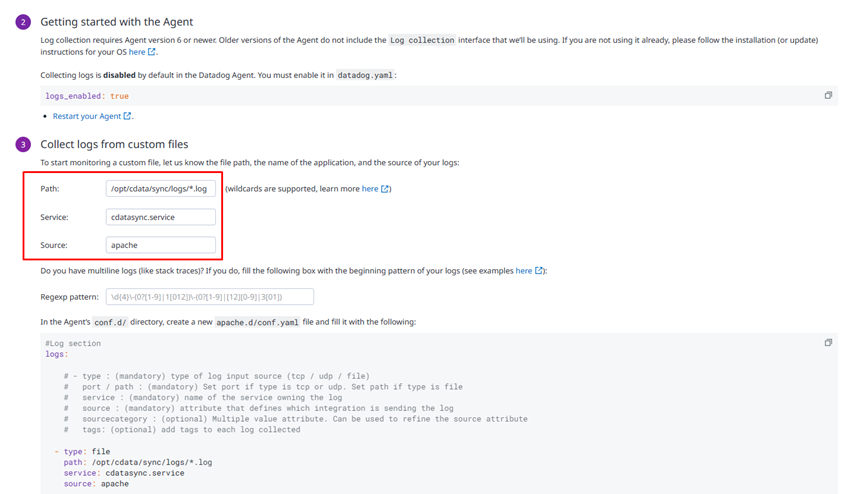
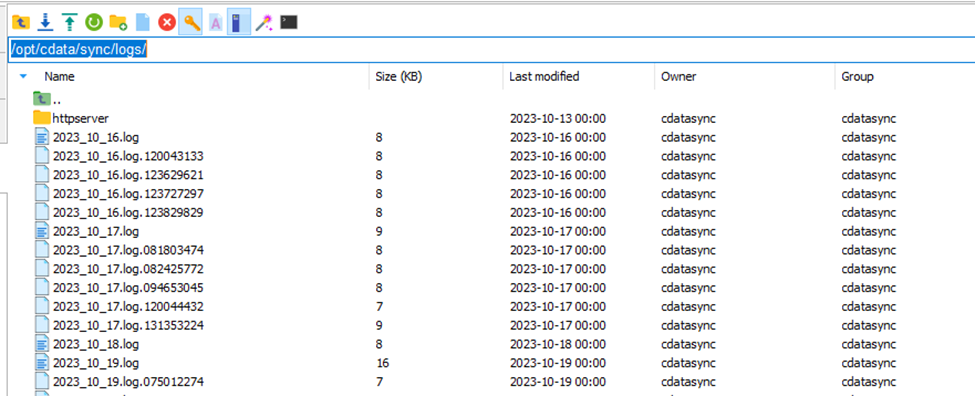
For the “Path” element, I have defined the directory where all Sync logfiles exist (as below):
For the “Service” element, I have defined the name of Sync service:
Once these steps are completed, in the Agent’s “conf.d”/ directory, create a new apache.d/conf.yaml file (as following):
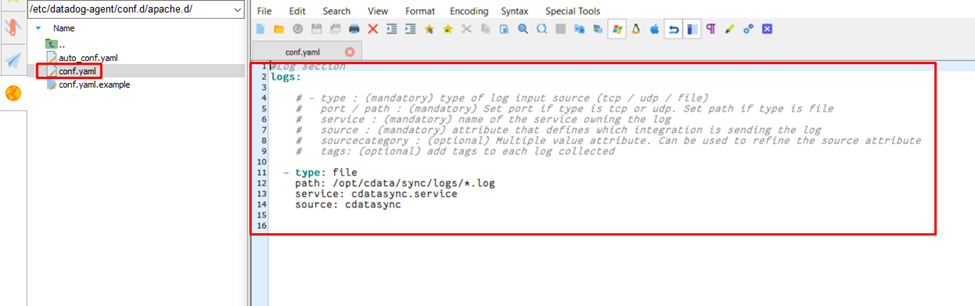
In the end, restart again the Agent and then you can continue shaping the look of your CData Sync logs data.
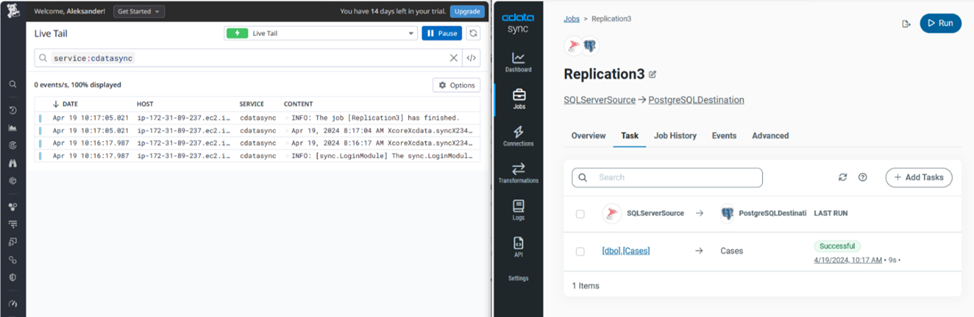
Example 1: Real-time monitoring of CData Sync job execution (Live Tail)
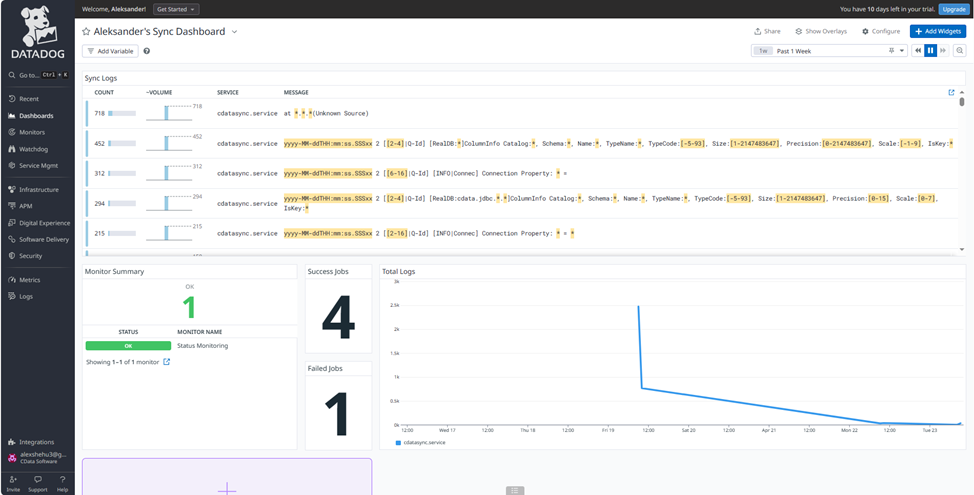
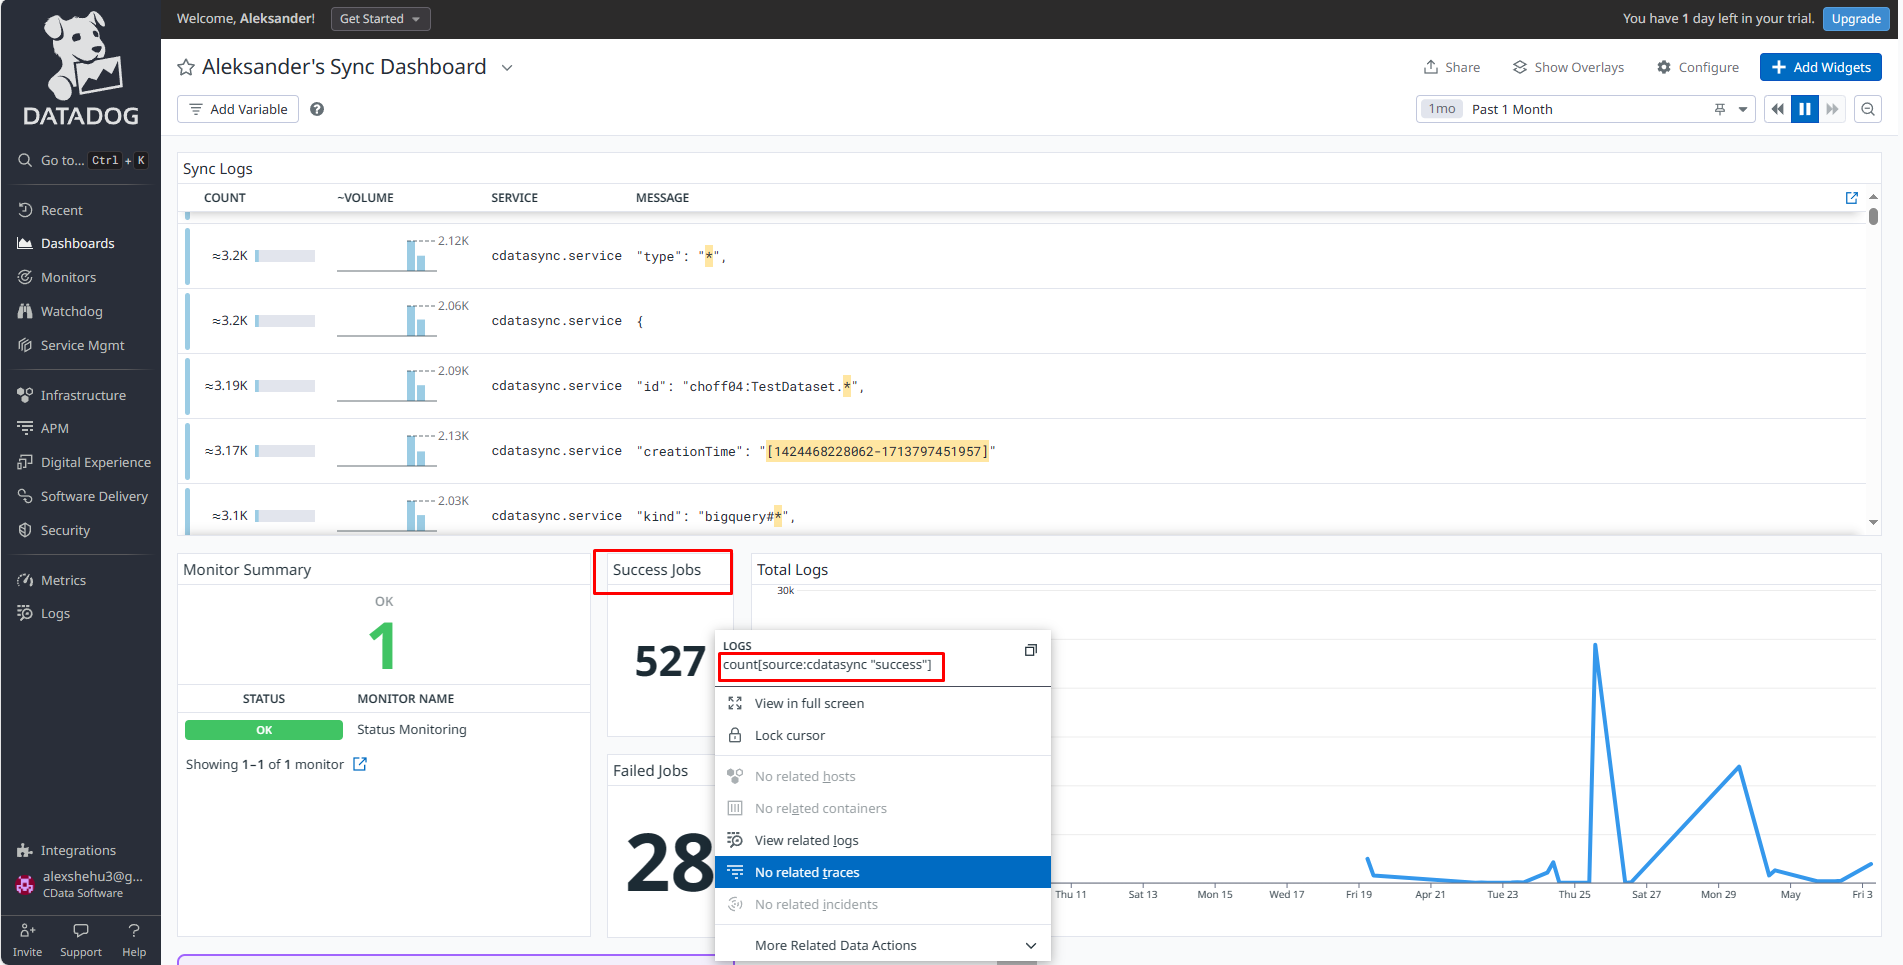
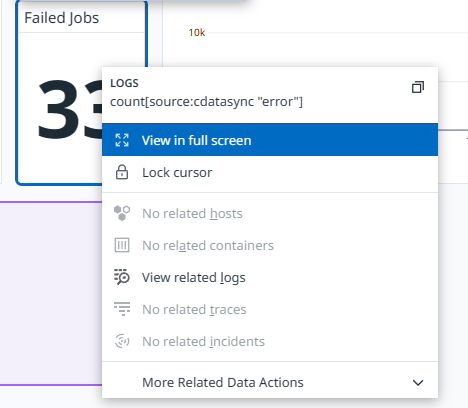
Example 2: CData Sync Dashboard (detailed sync logs, total number of logs, total number of successful/failed jobs, monitoring status)