About CData Arc log files
CData Arc, a comprehensive B2B integration application, maintains logs for a multitude of activities. These activities encompass Messages, Transactions, Application requests, Access requests, and Audit configuration changes. The logs are a critical tool for monitoring and managing the application’s operations. Each type of activity has its dedicated log, which is stored as a separate table in the application database. This segregation facilitates easy navigation and efficient management of logs.
Types of log files in CData Arc
CData Arc generates various categories of log files depending on the tasks it carries out.
1. Access logs
The Access log documents web requests directed towards the application’s public endpoints. This includes requests to the AS2 and AS4 endpoint (/pub/Receive.rsb), as well as any API calls, including those made via the built-in Admin API or any custom APIs created with the API connector.
It serves as a tool to confirm that the web server hosting the application receives web requests from external trading partners. If a partner tries to transmit a message using an HTTP-based protocol (such as AS2, AS4, etc.) and this request is absent from the Access Log, it implies the message isn’t reaching the application’s web server. This could suggest a fundamental connectivity issue, such as interference from a firewall, incorrect connection parameters, or a network outage.
2. Application logs
The Application log documents any errors at the application level that transpire during processing, as well as any requests made to application resources. The error messages in the Application Log can offer context to errors related to specific transactions.
It serves as a tool to confirm that web requests from external trading partners are successfully directed to a connector within the Arc flow. Upon receiving a web request at a public endpoint, the application attempts to route the message to a specific connector based on message headers (for example, AS2 Identifiers). If an error hinders the successful routing of the message, this error gets recorded in the Application Log.
3. Transaction logs
The Transaction Log holds comprehensive details about all incoming and outgoing file transfers, as well as all files processed locally by data transformation connectors. For instance, AS2 transaction logs include HTTP request and response headers, the MDN response to the AS2 request, and any communication errors.
It features a distinct row for each file processed by the application, and each row can be expanded to download the log file. Information about transactions for a specific connector can be found in that connector’s Input and Output tabs. The Transaction Log records both successful and unsuccessful transactions. Successful transactions will display a Status value of ‘Sent’ or ‘Received’, while unsuccessful transactions will indicate a status of ‘Error’.
4. Audit logs
Arc records every modification made to the application configuration in the Audit Log. This includes creating connectors, configuring connectors, updating profile settings, and more.
It provides details about the user who made the change, the timestamp of the change, and the resource used to execute the change. The resource could be either the Admin Console (the web UI commonly used for managing and configuring the application) or the Admin API (a REST-based API utilized for managing and configuring the application).
The Audit Log can be queried to conduct audits of the application configuration.
5. Web server logs
Arc also maintains logs for the underlying web server that hosts the application. These logs are relevant only when using the embedded web server for the Windows Edition of Arc. (For hosting with another web server, refer to that server’s documentation for information on server logs.)
Logs from the embedded web server can assist in diagnosing connectivity problems and configuration issues related to the web server itself. To access the server logs for the embedded web server:
- Right-click the Arc icon in the Windows system tray and select Server Options.
- Navigate to the 'Other' tab of the embedded web server UI.
- Enable 'Write Log to a File' and specify a file path on the disk.
- Adjust the log verbosity to include the desired level of detail and configure log rotation options as needed.
When running as a service, the application writes web server logs to a 'service.log' file in the application installation directory.
6. Debug logs
Some connectors offer settings in the Advanced Configuration tab to enhance the verbosity of transaction logs. These detailed logs prove useful during debugging and are often required when seeking support from [email protected].
The most common Advanced configuration setting is Log Level. When configured to Debug, additional information is appended to the transaction logs already generated during transaction processing.
Certain connectors that send outgoing requests also feature a Log Requests setting. Enabling this option to True results in transaction logs containing a replica of the request as sent to the remote server. This can aid in narrowing down any issues with receiving server responses.
For connectors issuing queries against remote systems, Verbosity and/or Logfile settings may be available. The Verbosity setting should be adjusted between 1 and 5 (where 5 represents the highest verbosity level and is recommended in most cases). When Logfile is accessible, specify a disk path to create the dedicated logfile; this file can be provided to Support along with the transaction logs generated during transaction processing.
Searching and Filtering the Logs
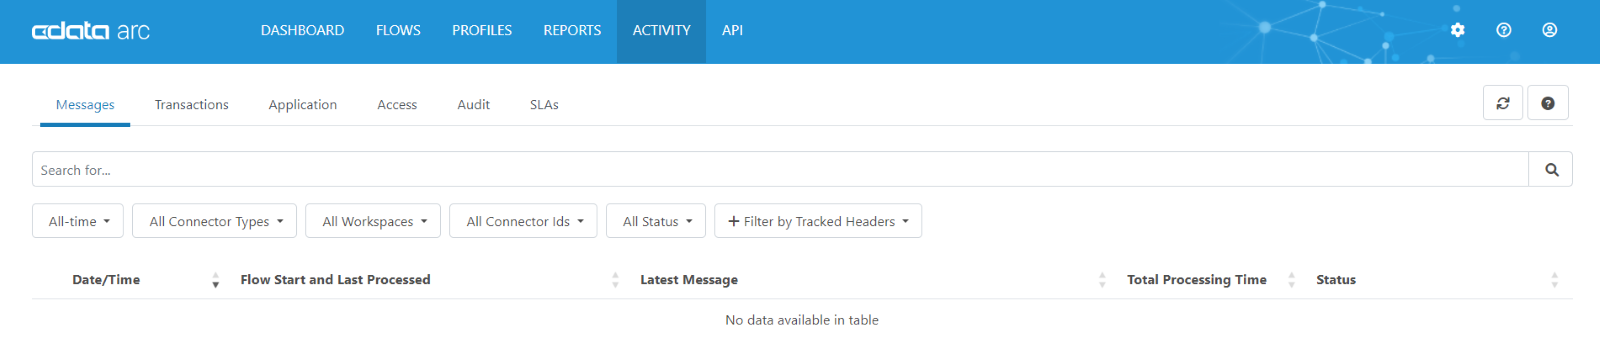
Users can access logs in the application via the Activity page, a user-friendly interface that provides a seamless experience for viewing and working with logs. At the top of every Activity page tab, there is a search bar available for searching all the logs on that page. Additionally, there is a context-sensitive filter section with various options tailored to each log type. For instance, the Messages tab includes filters for time, connector type, workspace, status, and Tracked Headers.
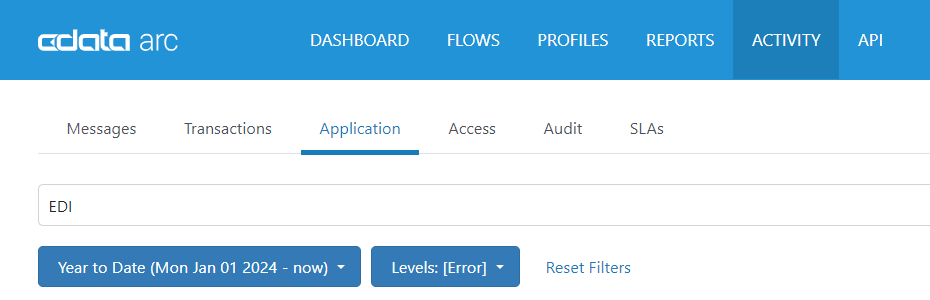
In an individual search, you have the option to utilize filter options and the search bar to refine the returned results. The image below illustrates Application messages within a specific time frame, filtered by a log level of Error and containing the word ‘EDI’ in the message text.
Tracked Headers
Arc supports the utilization of additional searchable metadata, known as Tracked Headers, to further filter results in the Messages and Transactions logs. Tracked headers can be added in several ways:
- The Tracked Headers field in the Advanced Settings section of the Settings > Advanced page allows users to input a comma-delimited list of custom header names.
- Certain connectors, such as X12, offer settings in the Advanced tab where users can opt-in to track specific headers, like ISA08.
- The XML Map connector lets users right-click on an element and add it as a tracked header in the output message.
- In ArcScript, the _message item enables users to set tracked headers using the _message.trackedheader:HeaderName syntax. For additional examples of using _message, please refer to the CData Arc Message.
As files are processed in the flow, Arc appends metadata headers to them. Users can locate these headers by clicking on the filename for a Transaction log entry. This can be done by:
- Expanding a message in the Messages or Transactions tab
- Opening the Message Details page
- Viewing the Input/Output tabs for a connector
Activities recorded by CData Arc logs
In the Activity page, CData Arc maintains logs for various activities, including Messages, Transactions, Application requests, Access requests, and Audit configuration changes. Each log type is presented in its tab and stored as a distinct table in the application database. Additionally, the activity page is not just limited to logs. It provides valuable insights into the Service Level Agreements (SLAs) configured across the application. Users can view the statuses of these SLAs, enabling them to monitor the application’s performance against the set benchmarks. This feature further enhances the application’s transparency and accountability.
Let’s try to understand the various activities recorded by CData Arc logs:
1. Messages Tab
The Messages tab offers a comprehensive insight into a message's journey throughout a flow, which may encompass multiple transactions. This feature allows users to view the entire process of a received message without the need to search for and inspect individual entries in the Transactions log.
Within the Messages table, users can access a full list of messages. By default, the list is sorted by the Date/Time column, but users can sort by any column using the up and down arrows provided. This table displays various details, including:
- Date/Time: The timestamp of the last activity related to the message.
- Flow Start and Last Processed: The Connector ID where the message originated and the Connector ID of the last connector to process a transaction related to the message. Clicking on either Connector ID directs users to the connector's configuration page in the flow designer.
- Latest Message: The latest filename associated with the message. Clicking this link opens a modal window that allows users to preview the message content and optionally download it.
- Total Processing Time: The duration the message was in the flow for processing.
- Status: Indicates the current status of the message, with options including Success, Warning, Error, Pending, and Skipped.
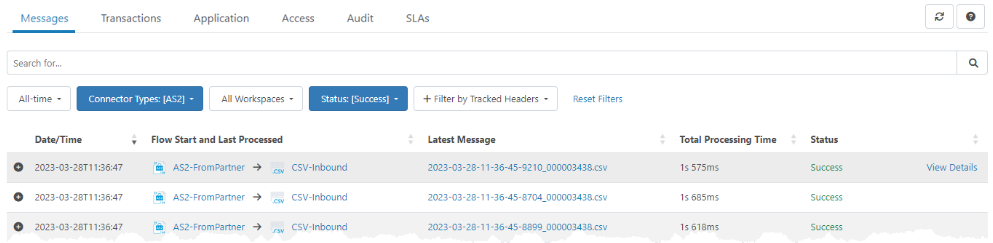
The Search bar and Filters section let users filter messages based on various criteria mentioned above and any Tracked Headers. An example filter is illustrated in the image below.
Use the download icon next to a log entry to download an individual log file. Use the Download All Logs button to download a zip file containing all the logs that pertain to the message.
To open the Message Details page for a message, click View Details. This page displays all transactions, logs, and related messages.
Select the ‘+’ symbol located to the left of a message to reveal a card that offers more details, as illustrated below.
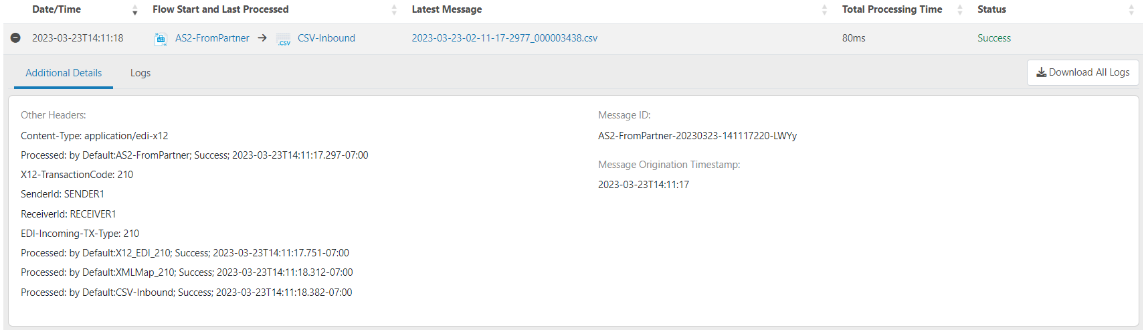
The card includes:
- A collection of Tracked Headers related to the message
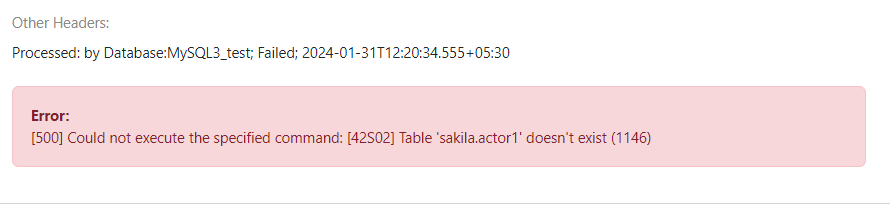
- A collection of Other Headers related to the message, which are not tracked
- The Message Id
- The timestamp indicating when the message was created
- Messages that are relevant to the status of the message. For instance, if the status is ‘Error’, the error message causing this status is displayed in the summary.
In the Logs tab for the message, you can find logs related to the message processing. To view the contents of the log-in user interface (and optionally download the file), click on the link in the ‘File Name’ column.
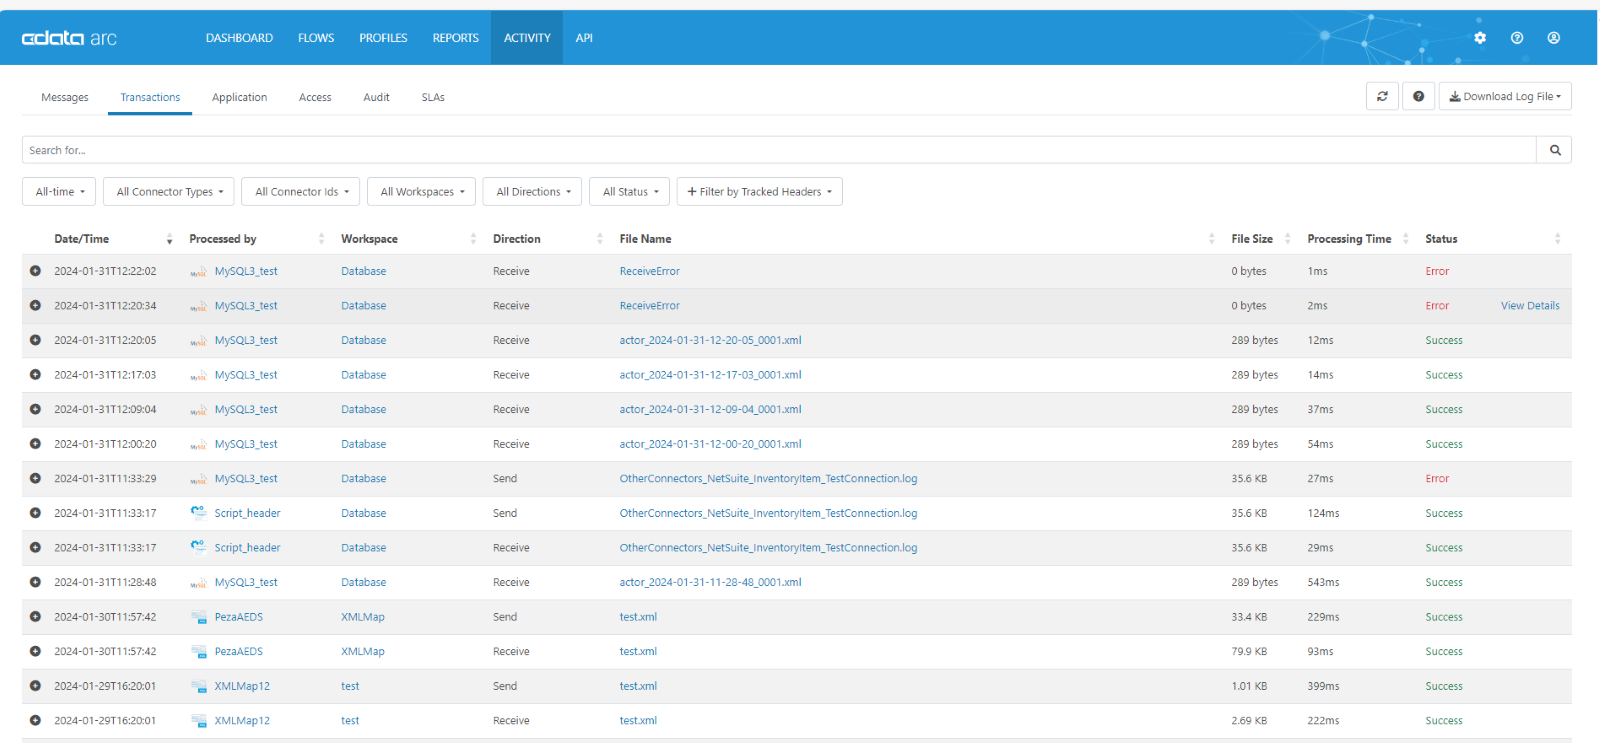
2. Transactions Tab
The Transactions tab provides comprehensive details about all incoming and outgoing file transfers, as well as files processed locally by data transformation connectors. For instance, AS2 transaction logs include HTTP request and response headers, the MDN response to the AS2 request, and any communication errors.
Each file processed by the application is represented by a separate row in the Transactions tab. The tab displays the following information:
- Date/Time: The timestamp of the transaction
- Processed by: The ID of the connector that processed the transaction
- Workspace: The workspace where the transaction was processed
- Direction: Indicates whether the transaction was a Send or Receive
- Message: The text of the transaction message
- File Size: The size of the transaction file
- Processing Time: The duration it took to process the transaction
- Status: The status of the transaction. Successful transactions are marked as ‘Success’, while failed transactions are marked as ‘Error’.
To view additional details, click the ‘+’ icon to the left of a transaction. These details are similar to those in the Message Log, with the only difference being that transaction logs display information for a single transaction, while a message log may contain multiple transactions.
Tip: You can also find transaction information for a specific connector in the ‘Input’ and ‘Output’ tabs of that connector.
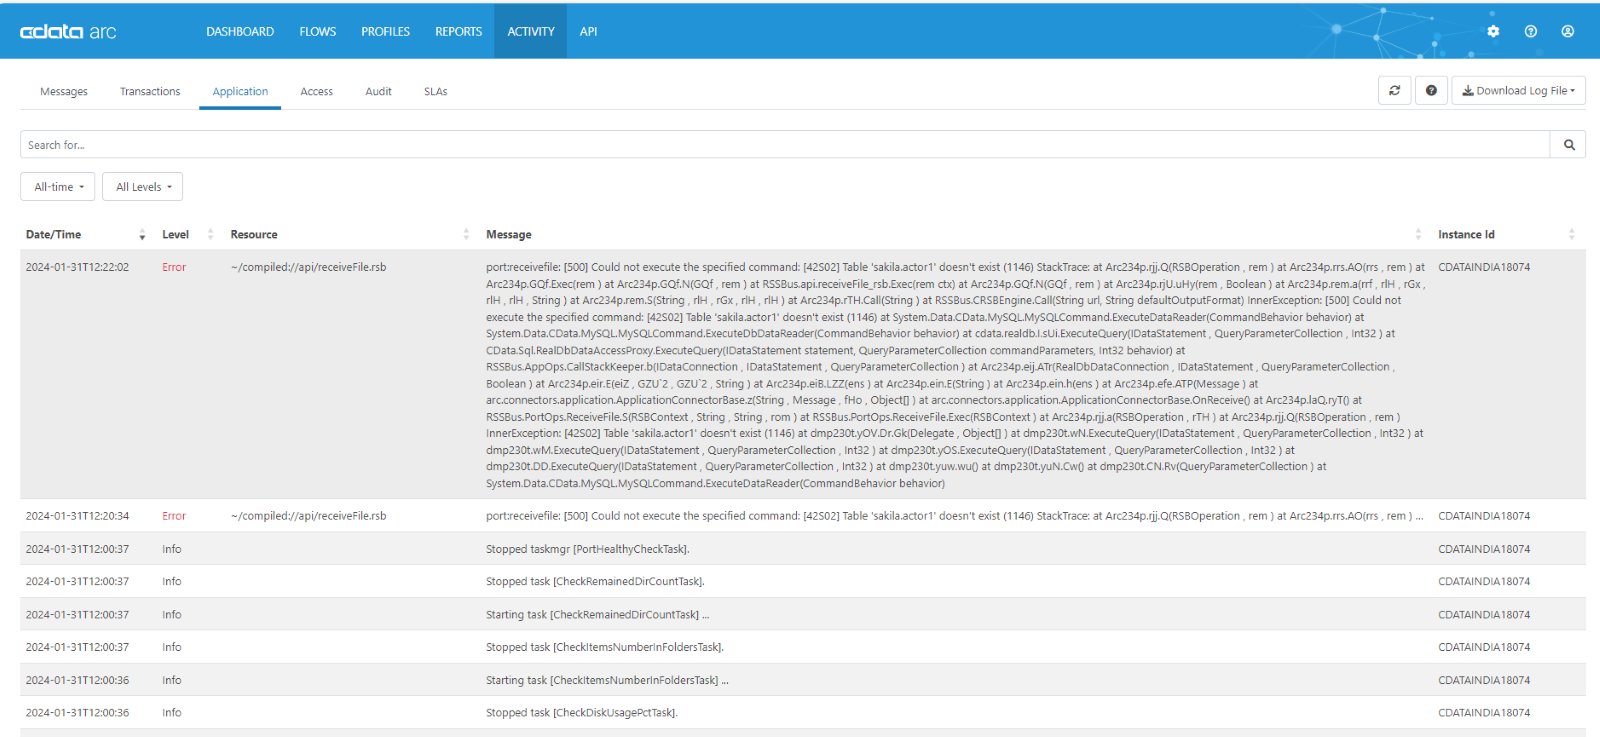
3. Application Tab
The Application tab logs any application-level errors that occur during processing and requests made to application resources. The error messages in this tab can provide context for specific transaction errors.
The Application tab can be used to confirm that web requests from external trading partners are successfully routed to a connector within the Arc flow. When the application receives a web request at a public endpoint, it tries to route the message to a specific connector based on message headers (for example, AS2 Identifiers). If an error prevents successful routing of the message, this error is displayed in the Application tab.
Each application event is represented by a separate row in the Application tab. It displays the following information:
- Date/Time: The timestamp of the event
- Level: The log levels. Refer to the information in the ‘Message’ column for details. The options are:
- None: Events are not logged
- Error: Information about errors encountered during processing
- Warning: Information about warnings encountered during processing
- Info: General information about the processing, including any errors and warnings (if applicable)
- Debug: Detailed debugging information for both successful and failed processes
- Trace: Detailed trace information for both successful and failed processes (useful if you need to send logs to CData Support)
You can change the log level in the Advanced Settings section of the Settings > Advanced page. However, increasing the verbosity of the logs can impact database performance, especially for less performant database types like SQLite or Derby. Adjust the log level only if necessary.
Note: The Debug and Trace logging levels might log sensitive information, including file information and SSL certificates. Although sensitive details such as passwords are masked, you should review these logs for sensitive information before sharing them outside of your organization.
- Resource: The resource that produced the message
- Message: The text of the message
- Instance Id: The machine where the event occurred
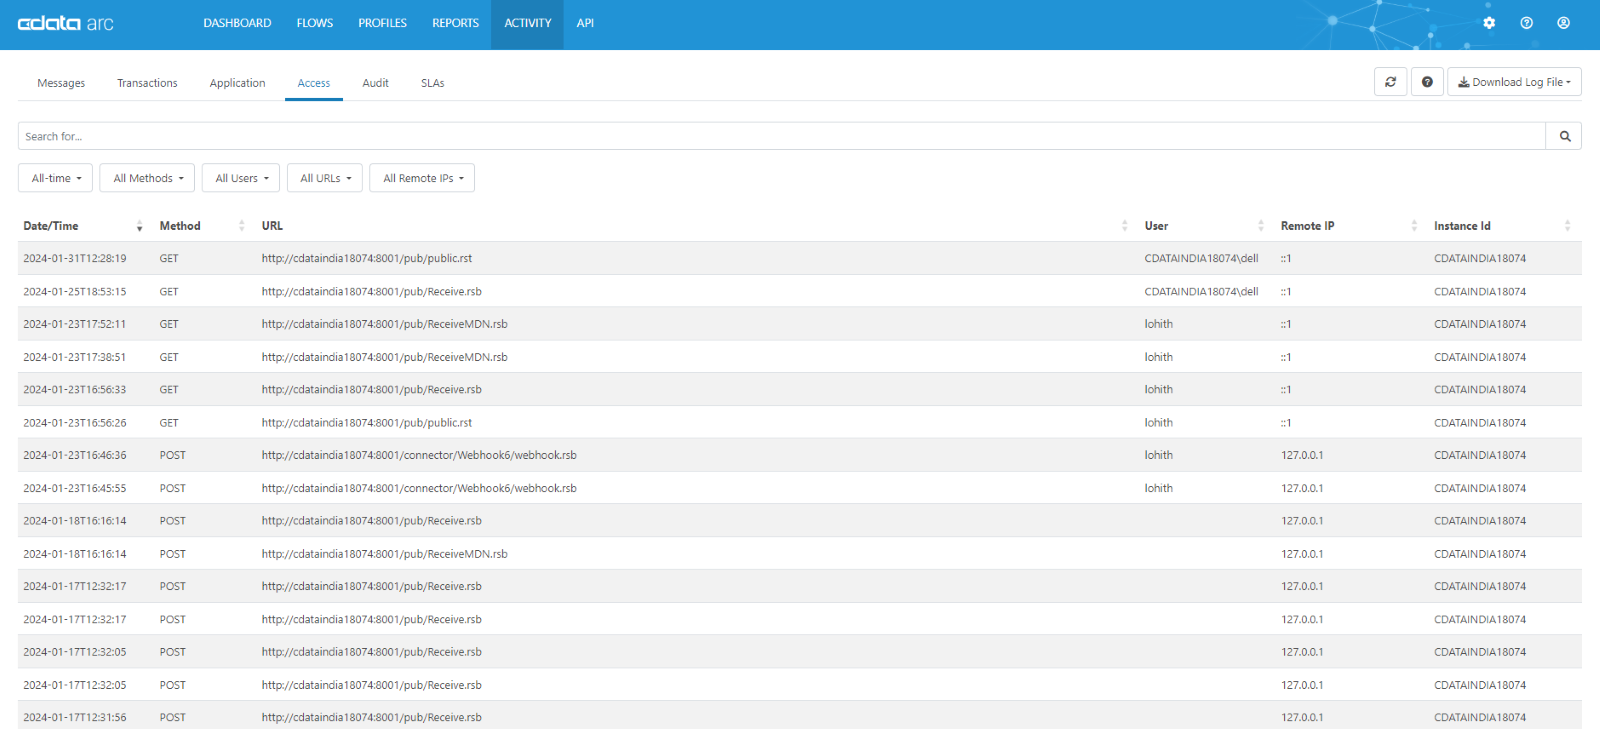
4. Access Tab
The Access tab logs entries for requests made to its provided endpoints. This includes API requests, connectors that expose a public endpoint (such as Webhook), and public endpoints related to data reception (for instance, public.rst). It displays the following information:
- Date/Time: The timestamp of the transaction
- Method: The HTTP method used
- URL: The URL
- User: The authenticated user who made the request. If the request was made by an anonymous user, this field is left blank.
- Remote IP: The IP Address from where the request originated
- Instance ID: The ID of the instance that served the request
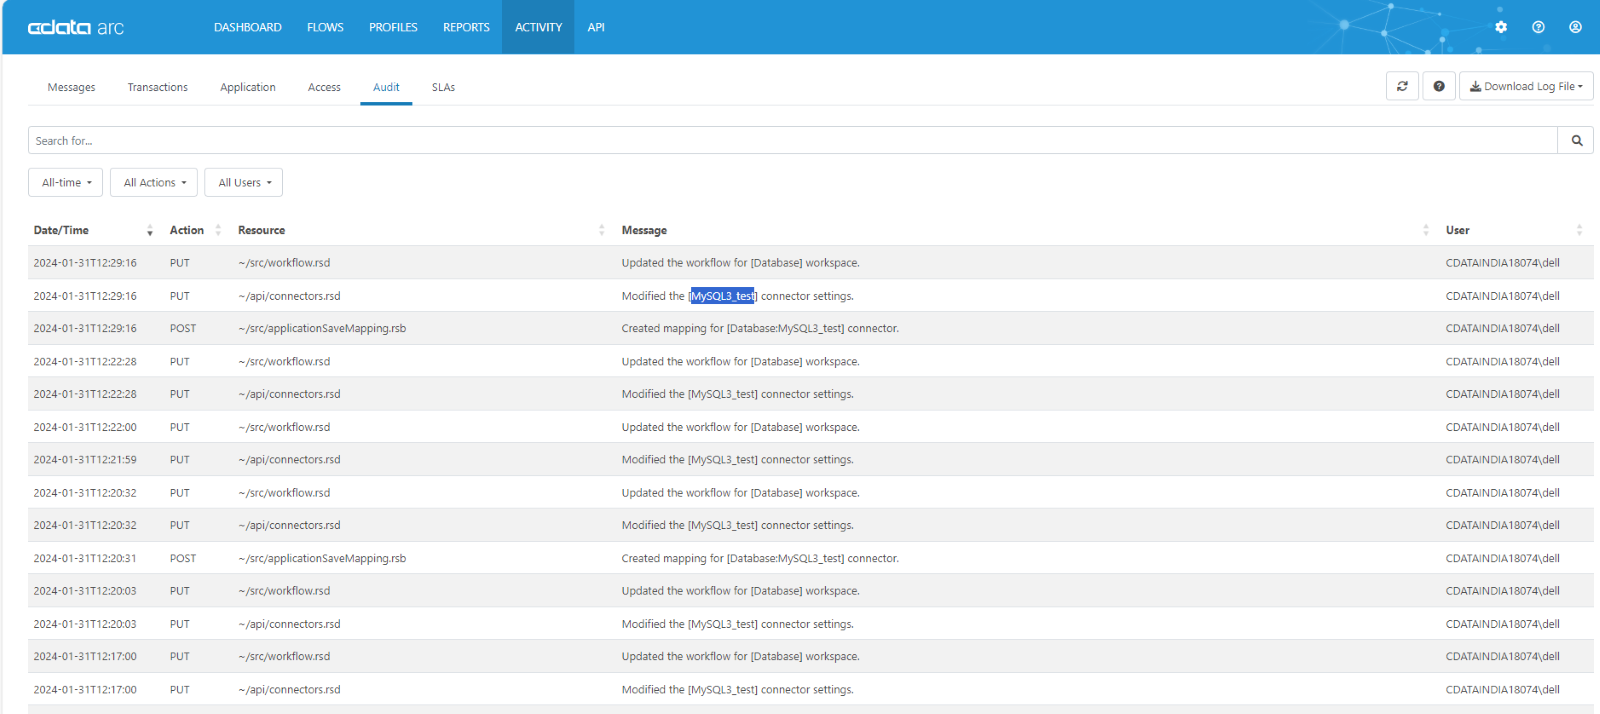
5. Audit Tab
The Audit tab is a repository for all modifications made to the application’s configuration. This encompasses actions such as the creation and configuration of connectors, updates to profile settings, and more. The details displayed on this tab include:
- Date/Time: The timestamp corresponding to the configuration modification.
- Action: The nature of the change executed. The possible actions are:
- GET
- POST
- PUT
- MERGE
- PATCH
- Resource: This could be either the Admin Console (the web-based user interface typically used for managing and configuring the application) or the Admin API (the REST-based API that can be utilized for managing and configuring the application).
- Message: A text description of the change.
- User: The individual who executed the change.
The Audit tab can be queried to conduct audits of the application’s configuration.
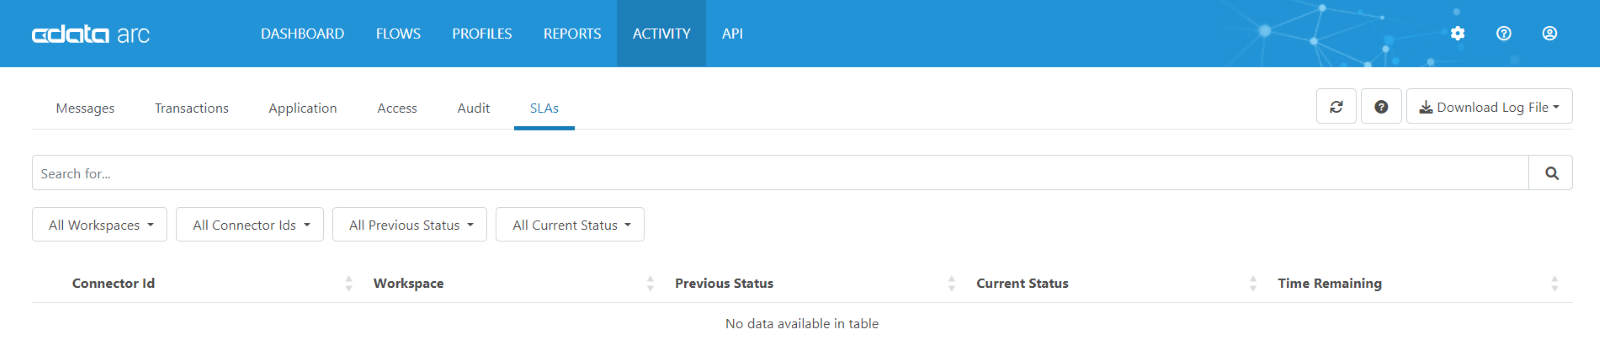
6. SLAs Tab
The SLAs tab maintains records of all SLAs set up for each connector. It provides details about the workspace linked with the SLA, the status details, and the remaining time in the current status. The following information is displayed:
- Connector ID: The identifier for each connector that has an SLA defined.
- Workspace: The name of the workspace associated with the SLA.
- Previous Status: The preceding status of the SLA (for instance, OK).
- Current Status: The present status of the SLA (for instance, At Risk).
- Time Remaining: The time left before the SLA transitions to another status (for instance, to In Violation).
Understanding the different types of log levels in the log files
In this segment, we aim to comprehend the various log levels in the transaction logs generated by CData Arc.
1. None
Events are not logged in this log level.
2. Error
This log level comprises details regarding errors encountered during the processing.
3. Warning
This log level provides information about warnings encountered during processing.
4. Info
It offers general information regarding the processing, including any encountered errors and warnings (if present).
[2024-01-31T12:00:20.415] [Info] Arc Version: 23.4.8789.0

[2024-01-31T12:00:20.417] [Info] System Version: Microsoft Windows 11 Pro

[2024-01-31T12:00:20.417] [Info] VM Version: 4.0.30319.42000

[2024-01-31T12:00:20.415] [Info] Provider: System.Data.CData.MySQL 23.0.8749.0

[2024-01-31T12:00:20.417] [Info] ConnectionString: Server=localhost;Port=3306;Database=abc_database;User=root;Password=***************;AuthScheme=Password;Domain=''; MaxLogFileCount=-1;MaxLogFileSize=100MB;Verbosity=1;OAuthEncryptKey=***************; ProxyPort=80; ProxySSLType=AUTO; ValidateStoredProcedureParameters=False; ZeroDatesToNull=True;oemkey=***************;

[2024-01-31T12:00:20.417] [Info] SQLCommand: SELECT * FROM `actor` limit 1;

[2024-01-31T12:00:20.420] [Info] -1 row(s) affected.

[2024-01-31T12:00:20.422] [Info] End generating XML file.

[2024-01-31T12:00:20.467] [Info] Message MySQL3_test-20240131-120020414-ehux is finalized. Name: actor_2024-01-31-12-00-20_0001.xml, Type: Output, Status: Success, Message: , Processing Time: 52ms.
5. Debug
This log level provides detailed debugging information for both successful and failed processes.
[2024-01-31T12:09:04.493] [Info] Arc Version: 23.4.8789.0

[2024-01-31T12:09:04.495] [Info] System Version: Microsoft Windows 11 Pro

[2024-01-31T12:09:04.495] [Info] VM Version: 4.0.30319.42000

[2024-01-31T12:09:04.493] [Info] Provider: System.Data.CData.MySQL 23.0.8749.0

[2024-01-31T12:09:04.495] [Info] ConnectionString: Server=localhost;Port=3306;Database=sakila;User=root;Password=***************;AuthScheme=Password; MaxLogFileCount=-1;MaxLogFileSize=100MB;Verbosity=5; OAuthEncryptKey=***************; ValidateStoredProcedureParameters=False;YearIsDateType=true;ZeroDatesToNull=True;oemkey=***************;

[2024-01-31T12:09:04.495] [Info] [REALDB] [ |Q-Id] [RealDB:MySQL]The connection is open.

…

[2024-01-31T12:09:04.496] [Debug] [DRIVER] 2024-01-31T12:09:04.460+05:30 4 [25|Q-Id] [INFO|Connec] Success: (13 ms)

…

[2024-01-31T12:09:04.496] [Debug] Created a new message: MySQL3_test-20240131-120904492-9sQN.

…

[2024-01-31T12:09:04.500] [Info] [DRIVER] 2024-01-31T12:09:04.500+05:30 2 [25|Q-Id] [EXEC|Messag] Executed query: [SELECT * FROM `actor` LIMIT 1] Success: (3 ms)

[2024-01-31T12:09:04.500] [Info] -1 row(s) affected.

[2024-01-31T12:09:04.501] [Debug] Result column(s): (actor_id, first_name, last_name, last_update)

[2024-01-31T12:09:04.501] [Debug] Matching record: ('1', 'Diby', 'Datta', '2022-06-08T16:59:22.0000+05:30')

[2024-01-31T12:09:04.503] [Info] End generating XML file.
6. Trace
This log level provides detailed trace information for both successful and failed processes (useful if you need to send logs to CData Support).
[2024-01-31T12:17:03.112] [Info] Arc Version: 23.4.8789.0

[2024-01-31T12:17:03.112] [Info] System Version: Microsoft Windows 11 Pro

[2024-01-31T12:17:03.112] [Info] VM Version: 4.0.30319.42000

[2024-01-31T12:17:03.112] [Info] Provider: System.Data.CData.MySQL 23.0.8749.0

[2024-01-31T12:17:03.112] [Info] ConnectionString: Server=localhost;Port=3306;Database=sakila;User=root;Password=***************;AuthScheme=Password;MaxLogFileSize=100MB;Verbosity=10;OAuthEncryptKey=***************; ValidateStoredProcedureParameters=False;YearIsDateType=true;ZeroDatesToNull=True;oemkey=***************;

[2024-01-31T12:17:03.112] [Info] [REALDB] [ |Q-Id] [RealDB:MySQL]The connection is open.
[2024-01-31T12:17:03.112] [Info] [DRIVER] 2024-01-31T12:17:03.092+05:30 2 [26|Q-Id] [TCP ] ConnectionStatus: Remote host connection complete. (0 - OK)

[2024-01-31T12:17:03.112] [Info] [DRIVER] 2024-01-31T12:17:03.092+05:30 2 [26|Q-Id] [TCP |Receiv] Connected (0 - OK)

[2024-01-31T12:17:03.112] [Info] [DRIVER] 2024-01-31T12:17:03.093+05:30 3 [26|Q-Id] [TCP |Receiv] DataIn, Length: 78

[2024-01-31T12:17:03.112] [Trace] [DRIVER] 2024-01-31T12:17:03.093+05:30 5 [26|Q-Id] [TCP |Receiv]
4A 00 00 00 0A 38 2E 30 2E 32 38 00 1D 00 00 00
55 0D 2E 01 62 18 63 52 00 FF FF FF 02 00 FF DF
15 00 00 00 00 00 00 00 00 00 00 5E 6A 22 32 5A
0C 63 4D 17 3A 2E 1F 00 63 61 63 68 69 6E 67 5F
73 68 61 32 5F 70 61 73 73 77 6F 72 64 00
[2024-01-31T12:17:03.112] [Info] [DRIVER] 2024-01-31T12:17:03.093+05:30 2 [ |Q-Id] Connection Handshake

[2024-01-31T12:17:03.112] [Info] [DRIVER] 2024-01-31T12:17:03.093+05:30 3 [ |Q-Id] Handshake Start

…

[2024-01-31T12:17:03.112] [Trace] [DRIVER] 2024-01-31T12:17:03.093+05:30 5 [26|Q-Id] [TCP |  Send  ]
63 00 00 01 8F A6 0B 00 FF FF FF 00 FF 00 00 00
00 00 00 00 00 00 00 00 00 00 00 00 00 00 00 00
00 00 00 00 72 6F 6F 74 00 20 8B 0C F3 97 37 21
72 92 8C 15 0C 68 4E 78 71 E7 96 BB E9 61 A4 9C
Log File Checklist
A log file contains a wealth of valuable information. Here are some initial recommendations for checking if the solution is not immediately evident:
- Review the log for any error messages in the HTTP responses.
- Verify and test the connections for each connector.
- Examine errors related to AS2 connections.
- Investigate general certificate errors.
- Look into errors specific to EDI Connectors such as X12 Connectors or EDIFACT Connectors.
- Ensure that XML mappings are correctly configured with the required fields.
- Validate that input strings are formatted correctly.
To learn more about troubleshooting common errors in CData Arc, read our documentation.
Try CData Arc Today
To effortlessly integrate EDI, MFT, and API workflows with your application infrastructure in the cloud or on-premises—without writing any code, sign up for a 30-day free trial of CData Arc.