Table of Contents
Introduction
Monitoring data processes in real time is vital for efficient operations and informed decision-making. CData Sync, a powerful ETL/ELT/Reverse ETL data replication tool, helps organizations move and sync data across platforms seamlessly. Equally important is tracking these processes—this is where the ELK stack (Elasticsearch, Logstash, and Kibana) comes in.
Whether you're a data engineer, DevOps professional, or simply exploring monitoring tools, this guide offers practical steps to set up effective monitoring of CData Sync using the ELK stack.
Overview of CData Sync
CData Sync is a powerful, user-friendly data integration tool designed to simplify the process of replicating, integrating, and transforming data across a wide variety of data sources. It supports cloud services, databases, and applications, providing businesses with the ability to maintain up-to-date, unified datasets. With a simple web-based interface and extensive support for automation, CData Sync ensures data remains consistent and accessible across platforms.
Overview of ELK stack
The ELK stack—comprising Elasticsearch, Logstash, and Kibana—is a widely-used open-source solution for centralized logging and data analysis. Here's a quick rundown of its components:
- Elasticsearch: A highly scalable search and analytics engine that stores and retrieves data.
- Logstash: A data processing pipeline that ingests, transforms, and sends logs to Elasticsearch.
- Kibana: A visualization tool that allows users to explore and analyze data stored in Elasticsearch via interactive dashboards.
Together, the ELK stack empowers organizations to manage large-scale log data, track metrics, and gain actionable insights.
Why integrate CData Sync with ELK stack?
CData Sync generates operational logs that provide insights into its activities, error patterns, and performance metrics. Monitoring these logs is critical for:
- Proactive Issue Resolution: Quickly identifying and addressing errors or anomalies.
- Performance Monitoring: Ensuring tasks run efficiently with minimal downtime.
- Compliance and Auditing: Keeping a record of data operations for compliance reporting.
The ELK stack enhances this process by:
- Collecting and processing CData Sync logs in real-time (via Logstash).
- Storing these logs in a centralized, scalable repository (Elasticsearch).
- Visualizing the data to identify trends, bottlenecks, and anomalies (Kibana).
The goal of this article is to demonstrate how to seamlessly integrate CData Sync logs with the ELK stack. The article will cover:
- Deploying both CData Sync and the ELK stack using Docker containers for simplicity and consistency.
- Configuring Logstash to ingest CData Sync logs and push them to Elasticsearch.
- Using Kibana to create dashboards and visualizations for analyzing the logs.
By the end of this project, you'll have a fully functional monitoring solution that provides centralized insights into your CData Sync operations, aiding in better monitoring, analysis, and decision-making.
Prerequisites
- Hardware & Software Requirements
- Operating System: A machine running a modern Linux distribution (Ubuntu 20.04 or later recommended). Windows and macOS are also supported with Docker installed.
- RAM: At least 8 GB (ELK stack and Docker containers can be resource-intensive).
- Storage: Sufficient disk space (at least 20 GB) for logs and containerized environments
- Docker installed (including Docker Compose)
Setting up CData Sync
You can either install Sync directly from CData website (https://www.cdata.com/sync/) or deploying it as a Docker container from this link. In both cases, make sure to activate CData Sync before proceeding further. Once it is installed and activated, generate some replication logs by performing some replications as per your requirements and verify their existence in the APP_DIRECTORY of CData Sync.
The following example illustrates the deployment of CData Sync as a containerized environment, where the APP_DIRECTORY (’/var/opt/sync’) is mounted to a custom path in the host via Docker volumes:
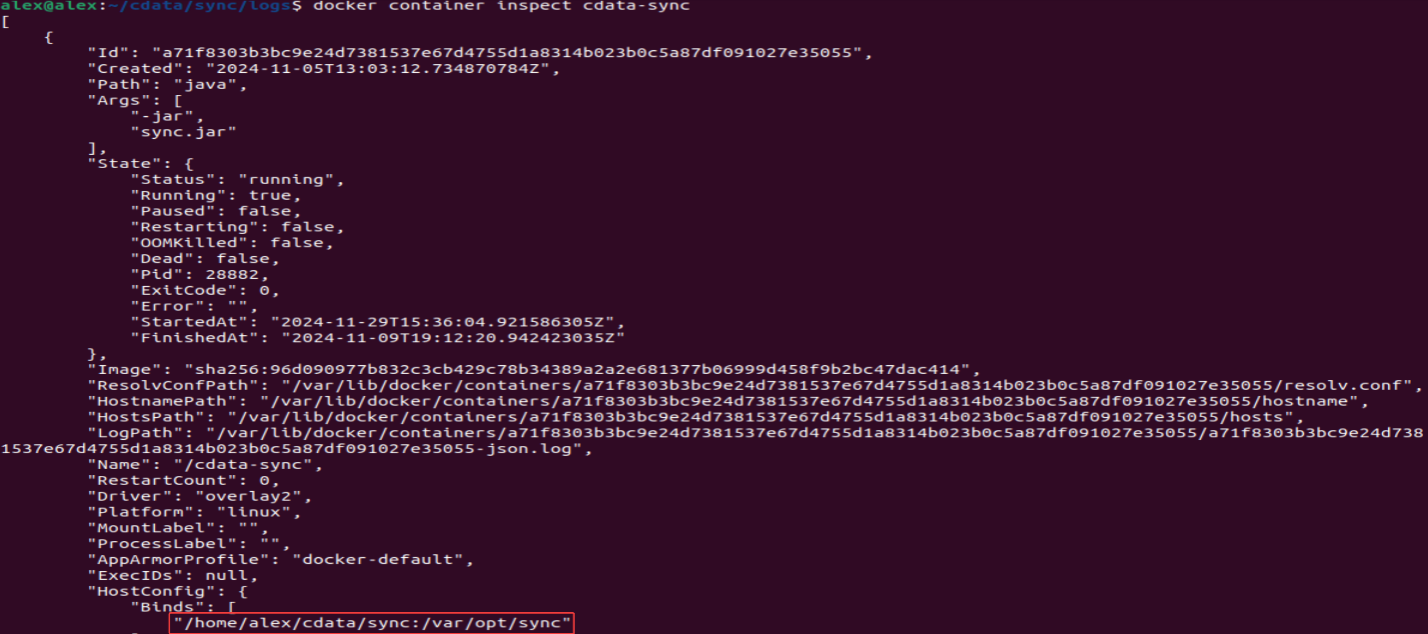
For the normal installation, APP_DIRECTORY and the rest of the configurations are explained on the official CData Sync documentation.
Deploying ELK stack
In this section, we use Docker Compose to deploy the ELK stack (Elasticsearch, Logstash, and Kibana) and configure it to ingest and visualize logs generated by CData Sync.
Below is the docker-compose.yml file for deploying the ELK stack:
services:

  Elasticsearch:

    image: elasticsearch:7.4.0

    container_name: elasticsearch

    restart: always

    volumes:

      - elastic_data:/usr/share/elasticsearch/data/

    environment:

      ES_JAVA_OPTS: "-Xmx256m -Xms256m"

      discovery.type: single-node

    ports:

      - '9200:9200'

      - '9300:9300'

    networks:

      - elk


  Logstash:

    image: logstash:7.4.0

    container_name: logstash

    restart: always

    volumes:

      - /home/alex/cdata/elk/logstash/logstash.conf:/usr/share/logstash/pipeline/logstash.conf

      - /home/alex/cdata/sync/logs:/usr/share/logstash/logs:ro

    depends_on:

      - Elasticsearch

    ports:

      - '9600:9600'

    environment:

      LS_JAVA_OPTS: "-Xmx256m -Xms256m"

    networks:

      - elk


  Kibana:

    image: kibana:7.4.0

    container_name: kibana

    restart: always

    ports:

      - '5601:5601'

    environment:

      - ELASTICSEARCH_URL=http://elasticsearch:9200

    depends_on:

      - Elasticsearch

    networks:

      - elk


volumes:

  elastic_data: {}


networks:

  elk:
The file configures the following services:
- Elasticsearch
- Logstash
- Kibana
Each service is defined with its respective Docker image, environment variables, volumes, ports, and networking configurations.
Once you create the file, open the directory where it is located and deploy the stack via the following command:
docker compose up -dGive it some time for the containers to get created and then verify they have been successfully deployed as following:
docker compose ps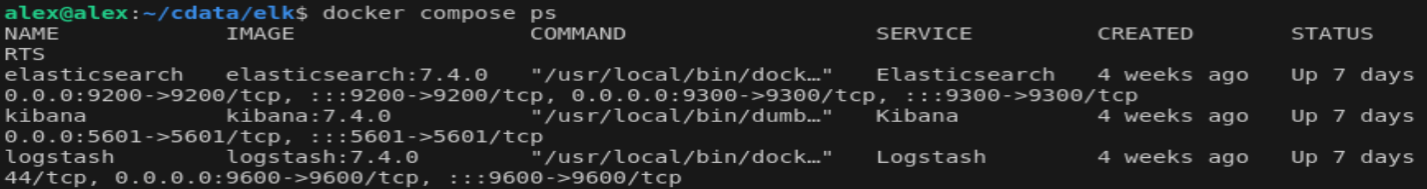
Integrating CData Sync logs with ELK stack
In this section, we configure Logstash to ingest CData Sync logs and send them to Elasticsearch for indexing. Once indexed, the logs will be ready to visualize in Kibana.
Ensure your logstash.conf file has the following configuration to read CData Sync logs and send them to Elasticsearch:
input {

  file {

    path => "/usr/share/logstash/logs/*.log"

    start_position => "beginning"

    sincedb_path => "/dev/null"

  }

}


filter {


  grok {

    match => {

      "message" => "%{TIMESTAMP_ISO8601:timestamp}\s+%{NUMBER:verbosity}\s+\[%{DATA:thread}\]\s+\[%{DATA:loglevel}\|%{DATA:module}\]\s+%{GREEDYDATA:log_message}"

    }

  }


  grok {

    match => {

      "log_message" => "Request completed in %{NUMBER:execution_time_ms:int} ms\\."

    }

  }


  grok {

    match => {

      "log_message" => "HTTP/%{NUMBER:http_version} %{NUMBER:status_code} %{WORD:status_message}"

    }

  }


  grok {

    match => {

      "log_message" => "Connection Property: %{DATA:property_name} = %{GREEDYDATA:property_value}"

    }

  }


  grok {

    match => {

      "log_message" => "Executing query: \\[%{GREEDYDATA:sql_query}\\]"

    }

  }


  grok {

    match => {

      "log_message" => "Executed query: \\[%{GREEDYDATA:executed_query}\\] Success: %{NUMBER:execution_time:int} ms"

    }

  }


  date {

    match => ["timestamp", "ISO8601"]

    target => "@timestamp"

  }


  if [loglevel] == "ERROR" {

    mutate { add_tag => ["error"] }

  } else if [loglevel] == "WARN" {

    mutate { add_tag => ["warning"] }

  } else if [loglevel] == "INFO" {

    mutate { add_tag => ["info"] }

  } else if [loglevel] == "DEBUG" {

    mutate { add_tag => ["debug"] }

  }

}


output {

  elasticsearch {

    hosts => ["http://elasticsearch:9200"]

    index => "cdata-sync-logs"

  }

  stdout { codec => rubydebug }

}
- “input” section tells Logstash where to read data from. In this case, it reads all the files that end with ‘.log’ extension from the directory which we mapped CData Sync logs path in the host machine with the Logstash path in the container machine.
- “filter” section processes the raw log data and extracts meaningful information. This configuration uses Grok for pattern matching and Date for timestamp processing.
- “output” section specifies where to send the processed log data. In this case, data is sent to Elasticsearch and also printed to the console for debugging.
Once the file is created and saved to the directory that is mapped with the Logstash path as per the configuration of the docker-compose file above, restart the ELK stack using Docker Compose to apply changes:
docker compose down
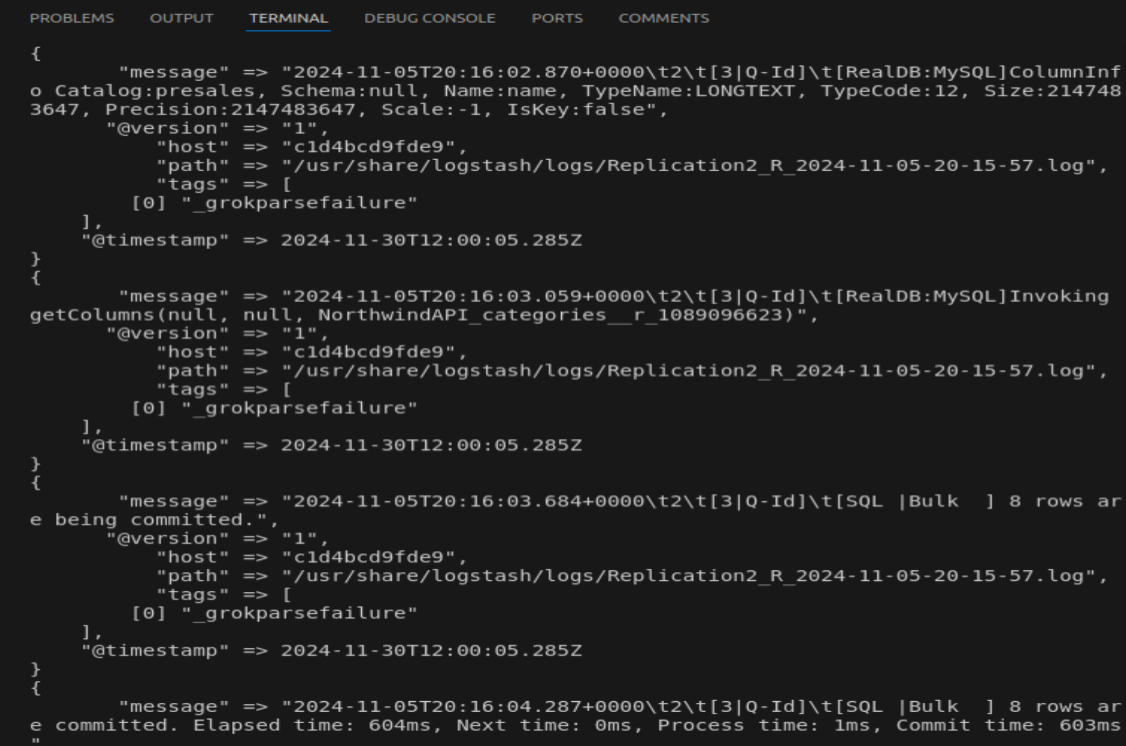
docker compose up -dCheck the Logstash logs to ensure it’s processing the CData Sync log files:
docker logs -f logstashYou should see parsed log entries similar to following:
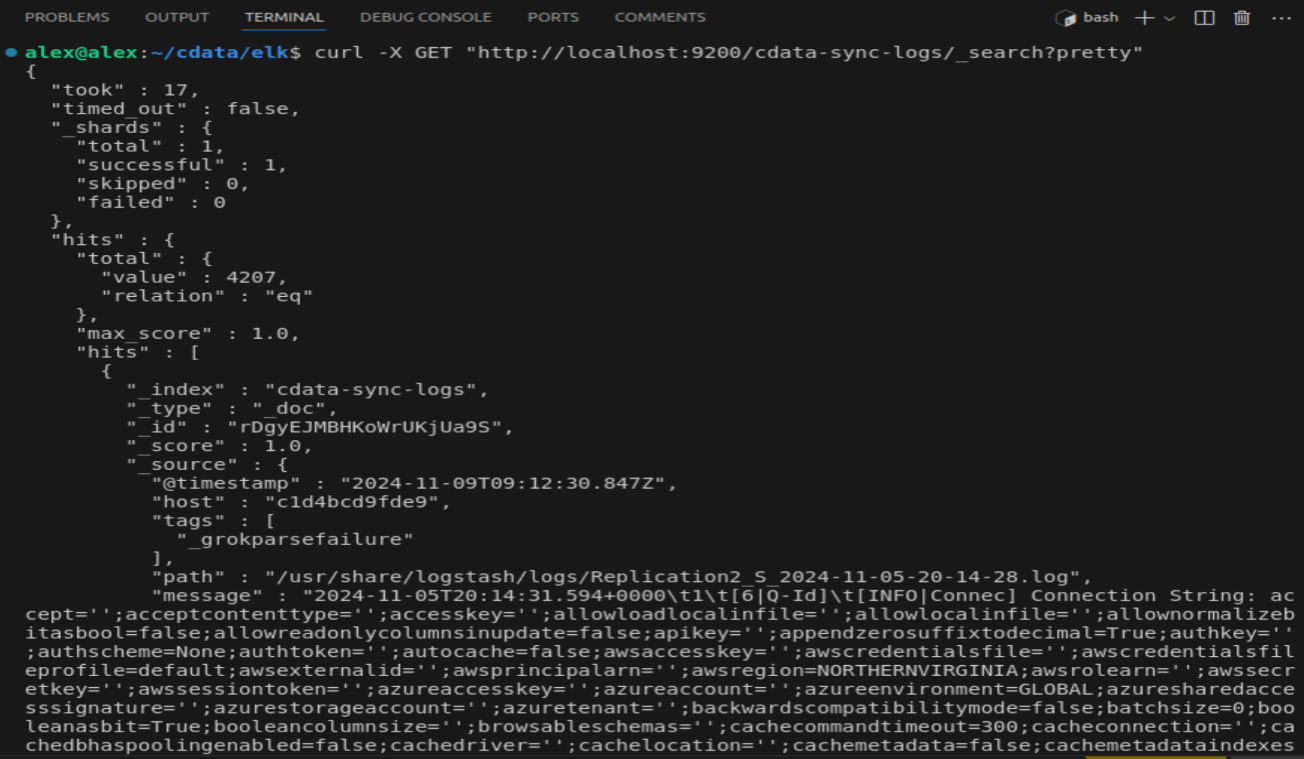
In addition, you can also check if the logs are indexed in Elasticsearch:
Visualizing logs in Kibana
In this section, we use Kibana to visualize CData Sync logs indexed in Elasticsearch. Kibana allows us to create dashboards, charts, and graphs for better insights and monitoring.
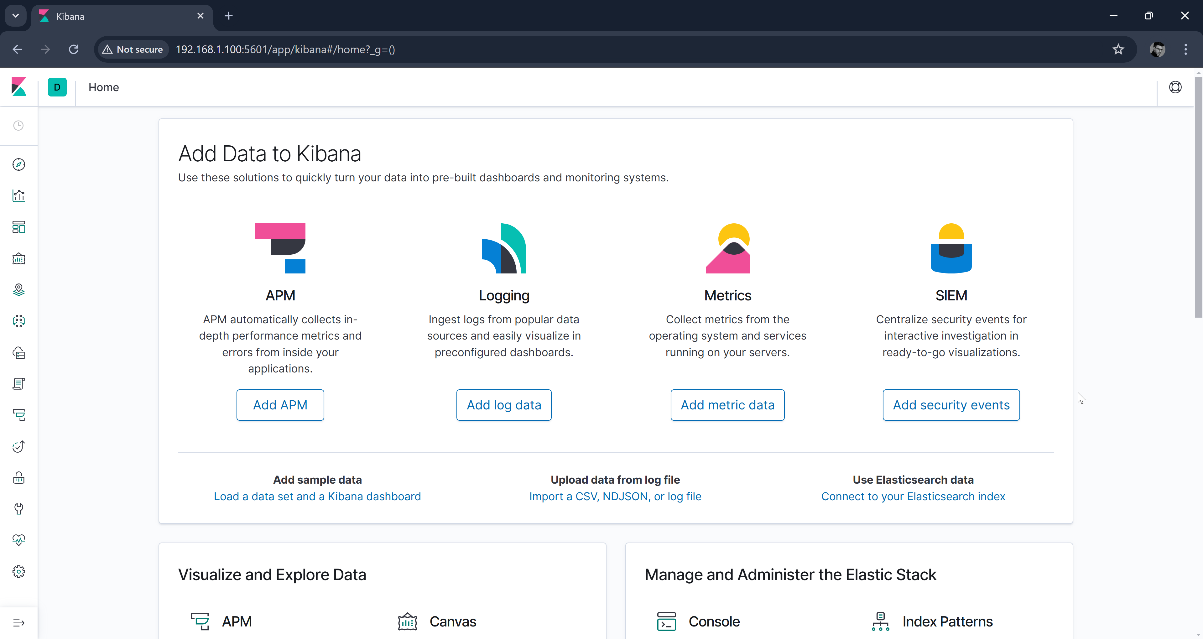
Firstly, access Kibana by opening a web browser and going to http://ip-address:5601
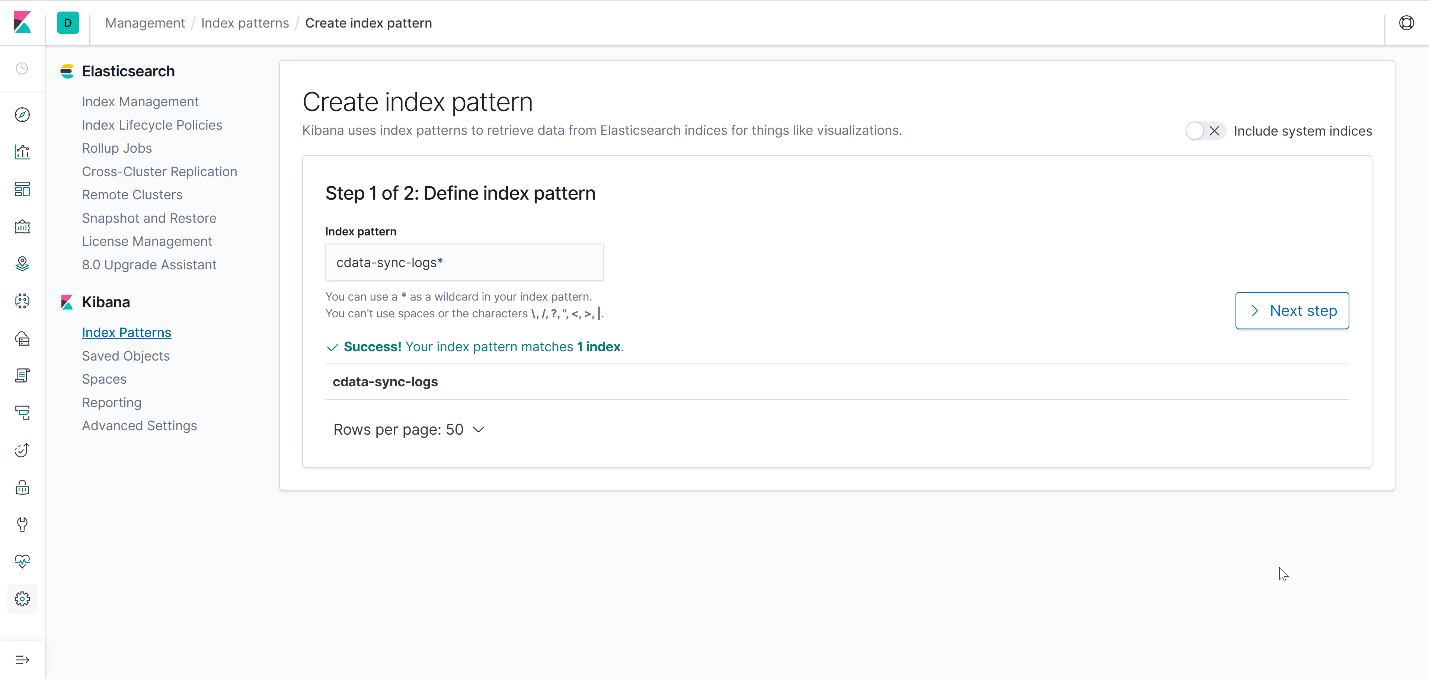
In to visualize the logs, you need to create an Index Pattern in Kibana. In the left sidebar, go to "Stack Management" → "Index Patterns". Once you are at the respective page, enter the name of the index that matches with the one configured in logstash.conf file (in this case cdata-sync-logs):
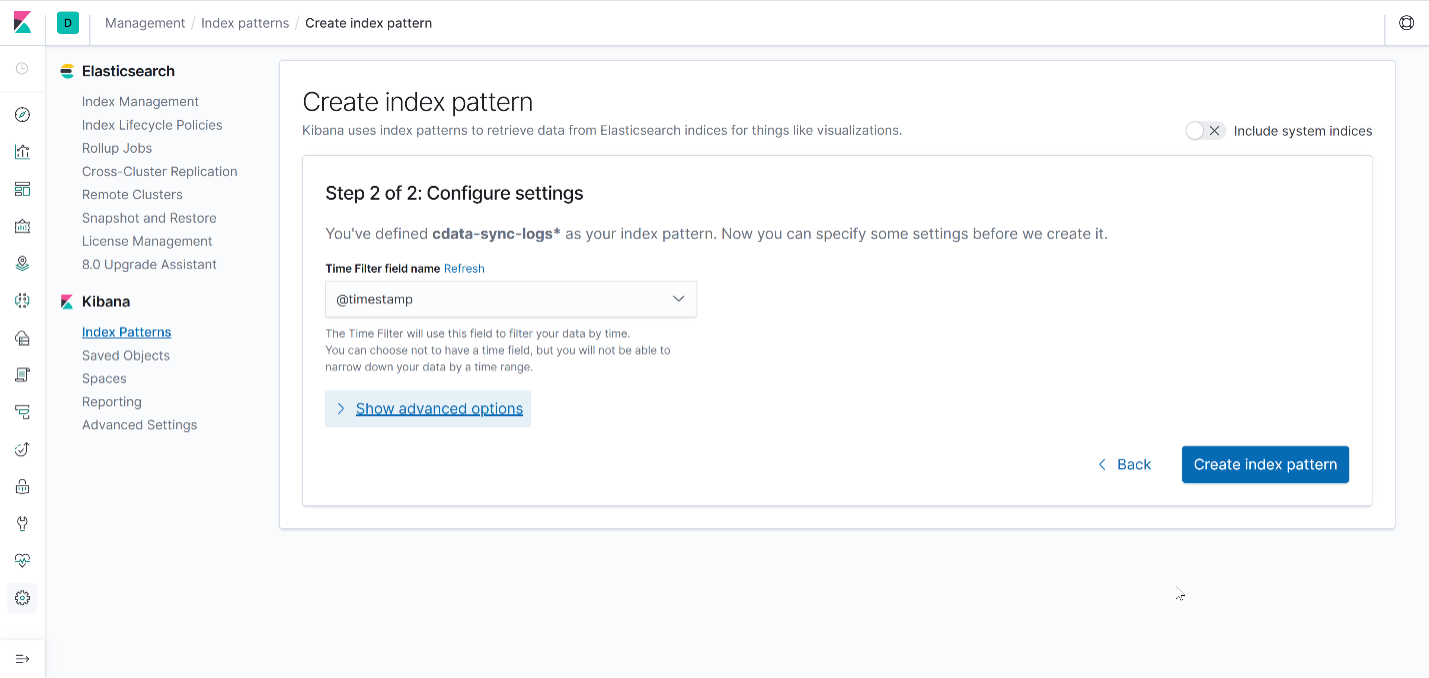
Next, configure the settings by selecting @timestamp as the Time Filter and create the index pattern:
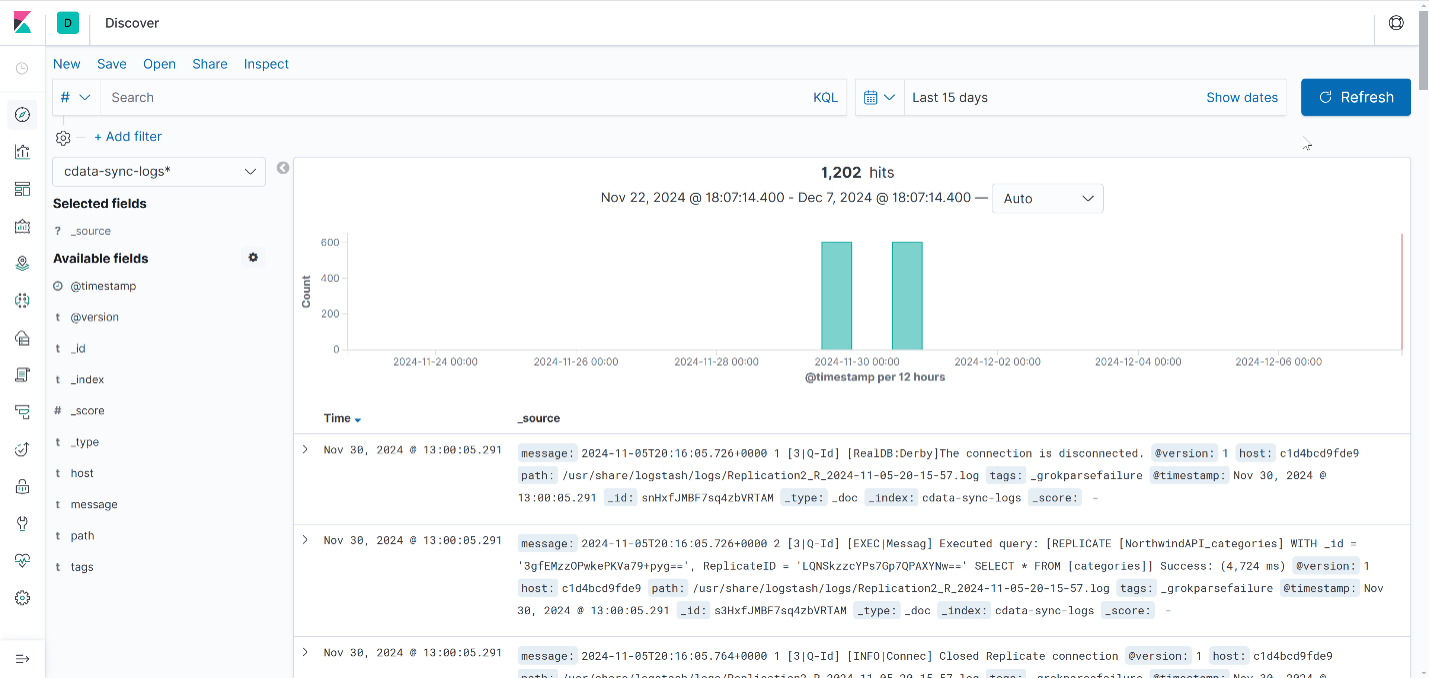
After creating the index pattern, you can explore the logs by going to “Discover” from the left sidebar. You should see the ingested CData Sync logs displayed in a tabular format:
CData Sync logging visualization ideas in Kibana
Effective monitoring of CData Sync operations requires meaningful visualization of log data. This subsection presents visualization ideas that leverage Kibana's capabilities to transform raw log data into actionable insights, helping you monitor system health, performance metrics, and potential issues in real-time. These visualizations can be combined into customized dashboards for comprehensive system monitoring.
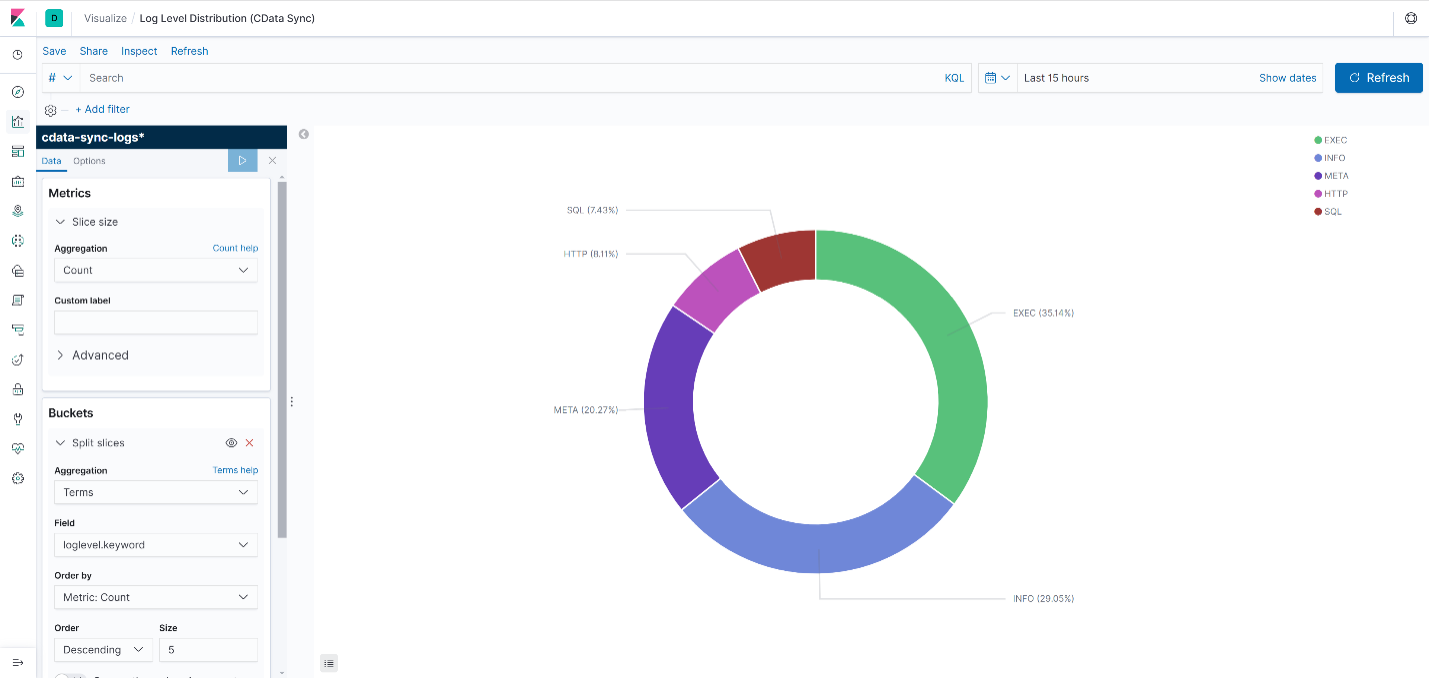
- Log Level Distribution
- Bar Chart or Pie Chart showing counts of loglevel (EXEC, INFO, ERROR, META, etc.):
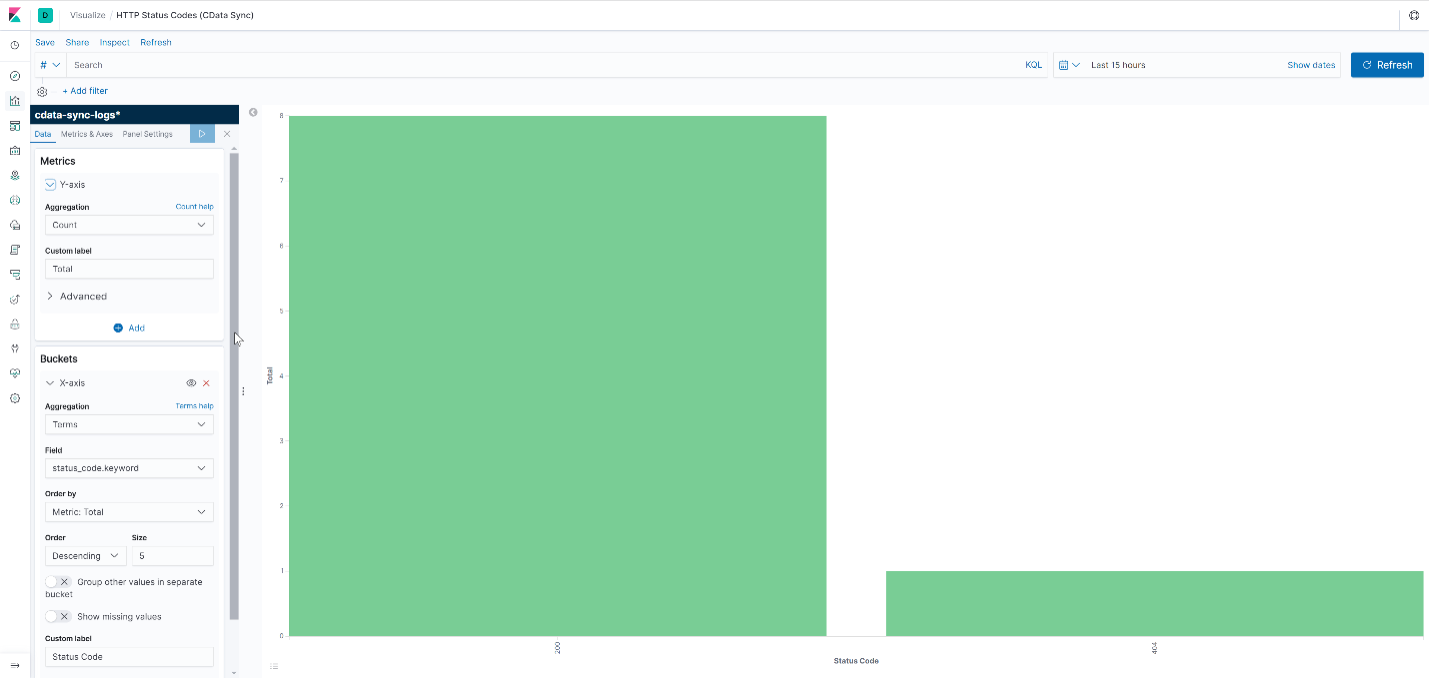
- HTTP Status Codes
- Bar Chart of status_code counts to monitor API response statuses.
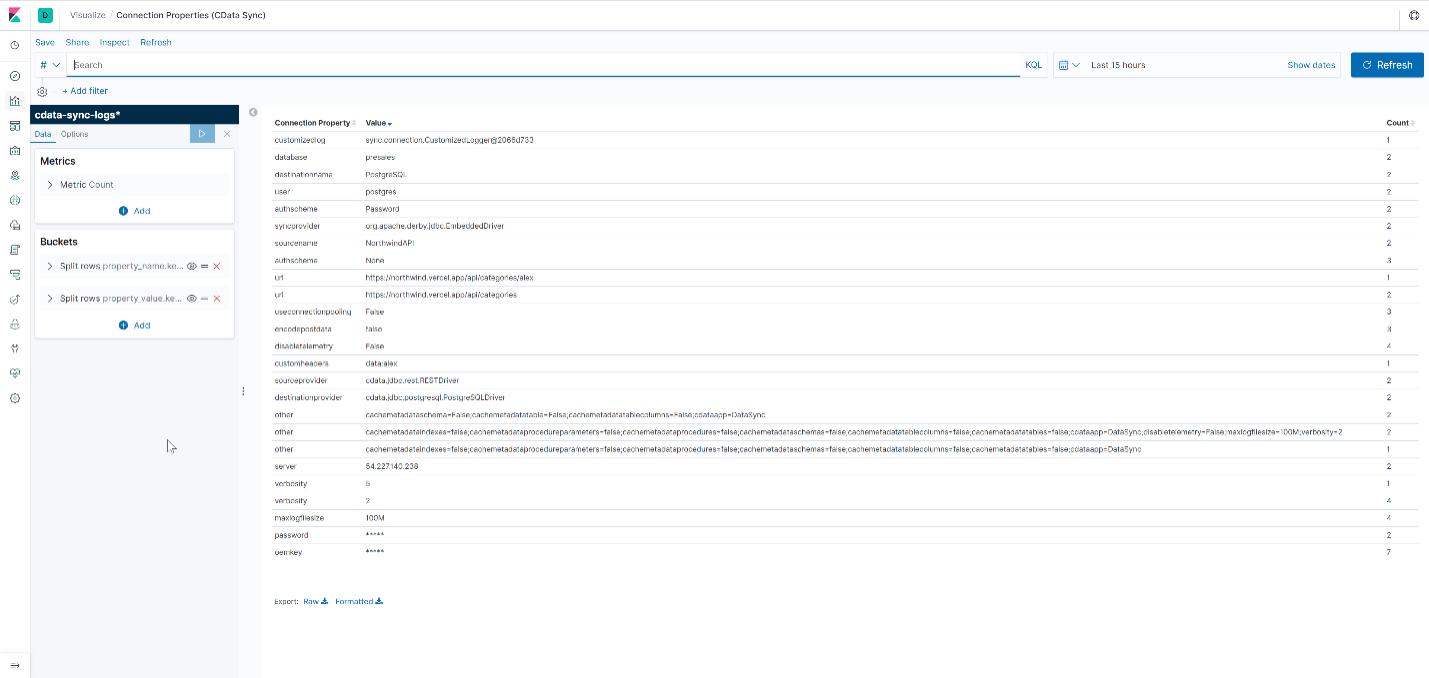
- Connection Properties
- Data Table showing property_name and property_value
DEMO: Real-time monitoring of CData Sync logging
This subsection demonstrates how real-time monitoring of CData Sync logging by integrating it with the ELK Stack (Elasticsearch, Logstash, and Kibana) is accomplished. The log generated during the replication task in CData Sync is ingested into Elasticsearch through Logstash, allowing for visualization and real-time tracking in Kibana. The real-time count of logs is visualized in a time series graph, enabling immediate insights into replication task performance and issues.
Conclusion
Integrating CData Sync with the ELK stack provides a robust solution for real-time monitoring and analysis of replication tasks. By utilizing Logstash to ingest logs into Elasticsearch and visualizing them through Kibana, you gain the ability to:
- Track Task Performance: Monitor execution times, statuses, and identify bottlenecks quickly.
- Detect Errors in Real Time: Instantly catch and troubleshoot errors or warnings.
- Centralize Logging: Consolidate logs from various replication tasks for easy querying and visualization.
- Enhance Debugging and Auditing: Utilize detailed log data for better insight into task operations and history.
This integration empowers users to maintain efficient data replication pipelines, improve system reliability, and respond proactively to issues. The combination of CData Sync and ELK stack ensures that you have a transparent and scalable logging solution tailored to your data replication needs.